API
Contents
API
SCENIC+ object
Combine single-cell expression data and single-cell accessibility into a single SCENIC+ object.
This object will be used for downstream analysis, including: region-to-gene and TF-to-gene linking, enhancer-driven-GRN building and further downstream analysis.
This object can be generated from both single-cell multi-omics data (i.e. gene expression and chromatin accessibility from the same cell), and seperate single-cell chromatin accessbility data and single-cell gene expression data from the same or similar sample.
In the second case both data modalities should have a common cell metadata field with values linking both modalities (e.g. common celltype annotation).
- class scenicplus.scenicplus_class.SCENICPLUS(X_ACC: Union[scipy.sparse._base.spmatrix, numpy.ndarray, pandas.core.frame.DataFrame], X_EXP: Union[scipy.sparse._base.spmatrix, numpy.ndarray, pandas.core.frame.DataFrame], metadata_regions: pandas.core.frame.DataFrame, metadata_genes: pandas.core.frame.DataFrame, metadata_cell: pandas.core.frame.DataFrame, menr: Mapping[str, Mapping[str, Any]], dr_cell: Optional[Mapping[str, numpy.iterable]] = None, dr_region: Optional[Mapping[str, numpy.iterable]] = None, uns: Mapping[str, Any] = {})[source]
An object containing: gene expression, chromatin accessbility and motif enrichment data.
SCENICPLUS
stores the data matricesX_ACC
(chromatin accessbility) andX_EXP
(gene expression) together with region annotationmetadata_regions
, gene annotationmetadata_genes
, cell annotationmetadata_cell
and motif enrichment datamenr
.Use create_SCENICPLUS_object to generate instances of this class.
- Parameters
- X_ACC: sparse.spmatrix, np.ndarray, pd.DataFrame
A #regions x #cells data matrix
- X_EXP: sparse.spmatrix, np.ndarray, pd.DataFrame
A #cells x #genes data matrix
- metadata_regions: pd.DataFrame
A
pandas.DataFrame
containing region metadata annotation of length #regions- metadata_genes: pd.DataFrame
A
pandas.DataFrame
containing gene metadata annotation of length #genes- metadata_cell: pd.DataFrame
A
pandas.DataFrame
containing cell metadata annotation of lenght #cells- menr: dict
A Dict containing motif enrichment results for topics of differentially accessbile regions (DARs), generate by pycistarget. Should take the form {‘region_set_name1’: {region_set1: result, ‘region_set2’: result}, ‘region_set_name2’: {‘region_set1’: result, ‘region_set2’: result}, ‘topic’: {‘topic1’: result, ‘topic2’: result}} region set names, which aren’t topics, should be columns in the
metadata_cell
dataframe- dr_cell: dict
A Dict containing dimmensional reduction coordinates of cells.
- dr_region: dict
A Dict containing dimmensional reduction coordinates of regions.
- Attributes
- n_cells: int
Returns number of cells.
- n_genes: int
Returns number of genes.
- n_regions: int
Returns number of regions.
- cell_names: List[str]
Returns cell names
- gene_names: List[str]
Returns gene names
- region_names: List[str]
Returns region names
Methods
add_cell_data
(cell_data)Add cell metadata
add_gene_data
(gene_data)Add gene metadata
add_region_data
(region_data)Add region metadata
subset
([cells, regions, genes, return_copy])Subset object
to_df
(layer)Generate a
DataFrame
.- add_cell_data(cell_data: pandas.core.frame.DataFrame)[source]
Add cell metadata
- Parameters
- cell_data: pd.DataFrame
A
DataFrame
containing cell metdata indexed with cell barcodes.
- add_gene_data(gene_data: pandas.core.frame.DataFrame)[source]
Add gene metadata
- Parameters
- gene_data: pd.DataFrame
A
DataFrame
containing gene metadata indexed with gene names.
- add_region_data(region_data: pandas.core.frame.DataFrame)[source]
Add region metadata
- Parameters
- region_data: pd.DataFrame
A
DataFrame
containing region metadata indexed with region names.
- subset(cells=None, regions=None, genes=None, return_copy=False)[source]
Subset object
- Parameters
- cells: List[str]
A list of cells to keep default: None
- regions: List[str]
A list of regions to keep default: None
- genes: List[str]
A list of genes to keep default:None
- return_copy: bool
A boolean specifying wether to update the object (False) or return a copy (True)
- scenicplus.scenicplus_class.create_SCENICPLUS_object(GEX_anndata: anndata._core.anndata.AnnData, cisTopic_obj: pycisTopic.cistopic_class.CistopicObject, menr: Mapping[str, Mapping[str, Any]], multi_ome_mode: bool = True, nr_metacells: Optional[Union[int, Mapping[str, int]]] = None, nr_cells_per_metacells: Union[int, Mapping[str, int]] = 10, meta_cell_split: str = '_', key_to_group_by: Optional[str] = None, imputed_acc_obj: Optional[pycisTopic.diff_features.CistopicImputedFeatures] = None, imputed_acc_kwargs: Mapping[str, Any] = {'scale_factor': 1000000}, normalize_imputed_acc: bool = False, normalize_imputed_acc_kwargs: Mapping[str, Any] = {'scale_factor': 10000}, cell_metadata: Optional[pandas.core.frame.DataFrame] = None, region_metadata: Optional[pandas.core.frame.DataFrame] = None, gene_metadata: Optional[pandas.core.frame.DataFrame] = None, bc_transform_func: Optional[Callable] = None, ACC_prefix: str = 'ACC_', GEX_prefix: str = 'GEX_') scenicplus.scenicplus_class.SCENICPLUS [source]
Function to create instances of
SCENICPLUS
- Parameters
- GEX_anndata: sc.AnnData
An instance of
AnnData
containing gene expression data and metadata.- cisTopic_obj: CistopicObject
An instance of
pycisTopic.cistopic_class.CistopicObject
containing chromatin accessibility data and metadata.- menr: dict
A dict mapping annotations to motif enrichment results
- multi_ome_mode: bool
A boolean specifying wether data is multi-ome (i.e. combined scATAC-seq and scRNA-seq from the same cell) or not default: True
- nr_metacells: int
For non multi_ome_mode, use this number of meta cells to link scRNA-seq and scATAC-seq If this is a single integer the same number of metacells will be used for all annotations. This can also be a mapping between an annotation and the number of metacells per annotation. default: None
- nr_cells_per_metacells: int
For non multi_ome_mode, use this number of cells per metacell to link scRNA-seq and scATAC-seq. If this is a single integer the same number of cells will be used for all annotations. This can also be a mapping between an annotation and the number of cells per metacell per annotation. default: 10
- meta_cell_split: str
Character which is used as seperator in metacell names default: ‘_’
- key_to_group_by: str
For non multi_ome_mode, use this cell metadata key to generate metacells from scRNA-seq and scATAC-seq. Key should be common in scRNA-seq and scATAC-seq side default: None
- imputed_acc_obj: CistopicImputedFeatures
An instance of
CistopicImputedFeatures
containing imputed chromatin accessibility. default: None- imputed_acc_kwargs: dict
Dict with keyword arguments for imputed chromatin accessibility. default: {‘scale_factor’: 10**6}
- normalize_imputed_acc: bool
A boolean specifying wether or not to normalize imputed chromatin accessbility. default: False
- normalize_imputed_acc_kwargs: dict
Dict with keyword arguments for normalizing imputed accessibility. default: {‘scale_factor’: 10 ** 4}
- cell_metadata: pd.DataFrame
An instance of
DataFrame
containing extra cell metadata default: None- region_metadata: pd.DataFrame
An instance of
DataFrame
containing extra region metadata default: None- gene_metadata: pd.DataFrame
An instance of
DataFrame
containing extra gene metadata default: None- bc_transform_func: func
A function used to transform gene expression barcode layout to chromatin accessbility layout. default: None
- ACC_prefix: str
String prefix to add to cell metadata coming from cisTopic_obj
- GEX_prefix: str
String prefix to add to cell metadata coming from GEX_anndata
Examples
>>> scplus_obj = create_SCENICPLUS_object(GEX_anndata = rna_anndata, cisTopic_obj = cistopic_obj, menr = motif_enrichment_dict)
Preprocessing
Filter outlier genes and regions.
- scenicplus.preprocessing.filtering.filter_genes(SCENICPLUS_obj: scenicplus.scenicplus_class.SCENICPLUS, min_pct: int = 0, max_pct: int = 100, return_copy=False) scenicplus.scenicplus_class.SCENICPLUS [source]
Filter scenciplus object genes
- Parameters
- SCENICPLUS_obj
An instance of :class: ~scenicplus.scenicplus_class.SCENICPLUS.
- min_pct
only keep genes which are expressed in at least min_pct of cells. default: 0
- max_pct
only keep genes which are expressed in maximal max_pct of cells. default: 100
- return_copy
If set to True a new SCENICPLUS object will be generated containing filtered data. default: False
- scenicplus.preprocessing.filtering.filter_regions(SCENICPLUS_obj: scenicplus.scenicplus_class.SCENICPLUS, min_pct: int = 0, max_pct: int = 100, return_copy=False) scenicplus.scenicplus_class.SCENICPLUS [source]
Filter scenciplus object regions
- Parameters
- SCENICPLUS_obj
An instance of :class: ~scenicplus.scenicplus_class.SCENICPLUS.
- min_pct
only keep regions which are accessible in at least min_pct of cells. default: 0
- max_pct
only keep regions which are accessible in maximal max_pct of cells. default: 100
- return_copy
If set to True a new SCENICPLUS object will be generated containing filtered data. default: False
SCENIC+ semi-automated workflow using wrapper functions
pycistarget wrapper
Wrapper functions to run motif enrichment analysis using pycistarget
After sets of regions have been defined (e.g. topics or DARs). The complete pycistarget workflo can be run using a single function.
this function will run cistarget based and DEM based motif enrichment analysis with or without promoter regions.
- scenicplus.wrappers.run_pycistarget.run_pycistarget(region_sets: Dict[str, pyranges.pyranges.PyRanges], species: str, save_path: str, custom_annot: Optional[pandas.core.frame.DataFrame] = None, save_partial: bool = False, ctx_db_path: Optional[str] = None, dem_db_path: Optional[str] = None, run_without_promoters: bool = False, biomart_host: str = 'http://www.ensembl.org', promoter_space: int = 500, ctx_auc_threshold: float = 0.005, ctx_nes_threshold: float = 3.0, ctx_rank_threshold: float = 0.05, dem_log2fc_thr: float = 0.5, dem_motif_hit_thr: float = 3.0, dem_max_bg_regions: int = 500, annotation: List[str] = ['Direct_annot', 'Orthology_annot'], motif_similarity_fdr: float = 1e-06, path_to_motif_annotations: Optional[str] = None, annotation_version: str = 'v9', n_cpu: int = 1, _temp_dir: Optional[str] = None, exclude_motifs: Optional[str] = None, exclude_collection: Optional[List[str]] = None, **kwargs)[source]
Wrapper function for pycistarget
- Parameters
region_sets (Mapping[str, pr.PyRanges]) – A dictionary of PyRanges containing region coordinates for the region sets to be analyzed.
species (str) – Species from which genomic coordinates come from, options are: homo_sapiens, mus_musculus, drosophila_melanogaster and gallus_gallus.
save_path (str) – Directory in which to save outputs.
custom_annot (pd.DataFrame) –
pandas DataFrame with genome annotation for custom species (i.e. for a species other than homo_sapiens, mus_musculus, drosophila_melanogaster or gallus_gallus). This DataFrame should (minimally) look like the example below, and only contains protein coding genes: >>> custom_annot
Chromosome Start Strand Gene Transcript_type
8053 chrY 22490397 1 PRY protein_coding 8153 chrY 12662368 1 USP9Y protein_coding 8155 chrY 12701231 1 USP9Y protein_coding 8158 chrY 12847045 1 USP9Y protein_coding 8328 chrY 22096007 -1 PRY2 protein_coding … … … … … … 246958 chr1 181483738 1 CACNA1E protein_coding 246960 chr1 181732466 1 CACNA1E protein_coding 246962 chr1 181776101 1 CACNA1E protein_coding 246963 chr1 181793668 1 CACNA1E protein_coding 246965 chr1 203305519 1 BTG2 protein_coding
[78812 rows x 5 columns]
save_partial (bool=False) – Whether to save the individual analyses as pkl. Useful to run analyses in chunks or add new settings.
ctx_db_path (str = None) – Path to cistarget database containing rankings of motif scores
dem_db_path (str = None) – Path to dem database containing motif scores
run_without_promoters (bool = False) – Boolean specifying wether the analysis should also be run without including promoter regions.
biomart_host (str = ‘http://www.ensembl.org’) – url to biomart host, make sure this host matches your assembly
promoter_space (int = 500) – integer defining space around the TSS to consider as promoter
ctx_auc_threshold (float = 0.005) – The fraction of the ranked genome to take into account for the calculation of the Area Under the recovery Curve
ctx_nes_threshold (float = 3.0) – The Normalized Enrichment Score (NES) threshold to select enriched features.
ctx_rank_threshold (float = 0.05) – The total number of ranked genes to take into account when creating a recovery curve.
dem_log2fc_thr (float = 0.5) – Log2 Fold-change threshold to consider a motif enriched.
dem_motif_hit_thr (float = 3.0) – Minimul mean signal in the foreground to consider a motif enriched.
dem_max_bg_regions (int = 500) – Maximum number of regions to use as background. When set to None, all regions are used
annotation (List[str] = ['Direct_annot', 'Orthology_annot']) – Annotation to use for forming cistromes. It can be ‘Direct_annot’ (direct evidence that the motif is linked to that TF), ‘Motif_similarity_annot’ (based on tomtom motif similarity), ‘Orthology_annot’ (based on orthology with a TF that is directly linked to that motif) or ‘Motif_similarity_and_Orthology_annot’.
path_to_motif_annotations (str = None) – Path to motif annotations. If not provided, they will be downloaded from https://resources.aertslab.org based on the specie name provided (only possible for mus_musculus, homo_sapiens and drosophila_melanogaster).
annotation_version (str = 'v9') – Motif collection version.
n_cpu (int = 1) – Number of cores to use.
_temp_dir (str = None) – temp_dir to use for ray.
exclude_motifs (str = None) – Path to csv file containing motif to exclude from the analysis.
exclude_collection (List[str] = None) – List of strings identifying which motif collections to exclude from analysis.
SCENIC+ wrapper
Wrapper functions to run SCENIC+ analysis
After the SCENIC+ object has been generated the complete SCENIC+ workflow can be run with a single function.
Following operation will be done:
Defining a search space surounding each gene
Region to gene linking & TF to gene linking
eGRN building
eGRN scoring (target gene and region based AUC and RSS)
Calculating TF-cistrome correlations
Dimensionality reductions
export to UCSC tracks and to loom file
In case the process is killed prematurely, the function can be restared and the workflow will resume from the last step that was succesfully completed.
- scenicplus.wrappers.run_scenicplus.run_scenicplus(scplus_obj: SCENICPLUS, variable: List[str], species: str, assembly: str, tf_file: str, save_path: str, biomart_host: Optional[str] = 'http://www.ensembl.org', upstream: Optional[List] = [1000, 150000], downstream: Optional[List] = [1000, 150000], region_ranking: Optional[CisTopicImputedFeatures] = None, gene_ranking: Optional[CisTopicImputedFeatures] = None, simplified_eGRN: Optional[bool] = False, calculate_TF_eGRN_correlation: Optional[bool] = True, calculate_DEGs_DARs: Optional[bool] = True, export_to_loom_file: Optional[bool] = True, export_to_UCSC_file: Optional[bool] = True, tree_structure: Sequence[str] = (), path_bedToBigBed: Optional[str] = None, n_cpu: Optional[int] = 1, _temp_dir: Optional[str] = '', **kwargs)[source]
Wrapper to run SCENIC+
- Parameters
scplus_obj (class::SCENICPLUS) – A SCENICPLUS object.
variables (List[str]) – Variables to use for RSS, TF-eGRN correlation and markers.
species (str) – Species from which data comes from. Possible values: ‘hsapiens’, ‘mmusculus’, ‘dmelanogaster’
assembly (str) – Genome assembly to which the data was mapped. Possible values: ‘hg38’
tf_file (str) – Path to file containing genes that are TFs
save_path (str) – Folder in which results will be saved
biomart_host (str, optional) – Path to biomart host. Make sure that the host matches your genome assembly
upstream (str, optional) – Upstream space to use for region to gene relationships
downstream (str, optional) – Upstream space to use for region to gene relationships
region_ranking (class::CisTopicImputedFeatures, optional) – Precomputed region ranking
gene_ranking (class::CisTopicImputedFeatures, optional) – Precomputed gene ranking
simplified_eGRN (bool, optional) – Whether to output simplified eGRNs (only TF-G sign rather than TF-G_R-G)
calculate_TF_eGRN_correlation (bool, optional) – Whether to calculate the TF-eGRN correlation based on the variables
calculate_DEGs_DARs (bool, optional) – Whether to calculate DARs/DEGs based on the variables
export_to_loom_file (bool, optional) – Whether to export data to loom files (gene based/region based)
export_to_UCSC_file (bool, optional) – Whether to export region-to-gene links and eregulons to bed files
tree_structure (sequence, optional) – Tree structure for loom files
path_bedToBigBed (str, optional) – Path to convert bed files to big bed when exporting to UCSC (required if files are meant to be used in a hub)
n_cpu (int, optional) – Number of cores to use
_temp_dir (str, optional) – Temporary directory for ray
Tools for non-automated workflow
Cistromes
Merging, scoring and assessing TF correlations of cistromes
- scenicplus.cistromes.TF_cistrome_correlation(scplus_obj: scenicplus.scenicplus_class.SCENICPLUS, variable: Optional[str] = None, use_pseudobulk: bool = True, auc_key: str = 'Cistromes_AUC', signature_key: str = 'Unfiltered', out_key: str = 'Unfiltered', subset: Optional[List[str]] = None)[source]
Get correlation between gene expression and cistrome accessibility
- Parameters
scplus_obj (
SCENICPLUS
) – ASCENICPLUS
object with pseudobulk matrices (scplus_obj.uns[‘Pseudobulk’])variable (str, optional) – Variable used to create the pseudobulks. Must be a key in scplus_obj.uns[‘Pseudobulk’]. Only required if use_pseudobulk is False.
use_pseudobulk (bool, optional) – Whether to use pseudobulk matrix or actual values.
cistromes_key (str, optional) – Key to retrieve the pseudobulk matrices. Cistrome accessibility will be retrieved from scplus_obj.uns[‘Pseudobulk’][variable][‘Cistromes_AUC’][cistromes_key] and gene expression from scplus_obj.uns[‘Pseudobulk’][variable][‘Expression’].
out_key (str, optional) – Ouput key. Correlations will be stored at scplus_obj.uns[‘TF_cistrome_correlation’][variable][out_key].
subset (List, optional) – Subset of cells to be used to calculate correlations. Default: None (All)
- scenicplus.cistromes.cistrome_correlation(scplus_obj: scenicplus.scenicplus_class.SCENICPLUS, variable: Optional[str] = None, use_pseudobulk: bool = True, auc_key: str = 'Cistromes_AUC', signature_key1: str = 'Gene_based', signature_key2: str = 'Region_based', out_key: str = 'Unfiltered', subset: Optional[List[str]] = None)[source]
Get correlation between gene-based and region-based AUC
- Parameters
scplus_obj (
SCENICPLUS
) – ASCENICPLUS
object with pseudobulk matrices (scplus_obj.uns[‘Pseudobulk’])variable (str, optional) – Variable used to create the pseudobulks. Must be a key in scplus_obj.uns[‘Pseudobulk’]. Only required if use_pseudobulk is False.
use_pseudobulk (bool, optional) – Whether to use pseudobulk matrix or actual values.
auc_key (str, optional) – Key to retrieve the pseudobulk matrices. Cistrome AUCs will be retrieved from scplus_obj.uns[‘Pseudobulk’][variable][‘Cistromes_AUC’][cistromes_key][signature_key1] and gene expression from scplus_obj.uns[‘Pseudobulk’][variable][‘Cistromes_AUC’][cistromes_key][signature_key2].
out_key (str, optional) – Output key. Correlations will be stored at scplus_obj.uns[‘cistrome_correlation’][variable][out_key].
subset (List, optional) – Subset of cells to be used to calculate correlations. Default: None (All)
- scenicplus.cistromes.generate_pseudobulks(scplus_obj: scenicplus.scenicplus_class.SCENICPLUS, variable: str, normalize_expression: bool = True, auc_key: str = 'Cistromes_AUC', signature_key: str = 'Unfiltered', nr_cells: int = 10, nr_pseudobulks: int = 100, seed: int = 555)[source]
Generate pseudobulks based on the cistrome AUC matrix and gene expression
- Parameters
scplus_obj (
SCENICPLUS
) – ASCENICPLUS
object with scored cistromes (scplus_obj.uns[‘Cistromes_AUC’][cistromes_key])variable (str, optional) – Variable to create pseudobulks by. It must ve a column in scplus_obj.metadata_cell
cistromes_key (str, optional) – Key to store where cistromes AUC values are stored. Cistromes AUC will retrieved from scplus_obj.uns[‘Cistromes_AUC’][cistromes_key] and the pseudobulk matrix will be stored at scplus_obj.uns[‘Pseudobulk’][‘Cistromes_AUC’][variable][cistromes_key] and scplus_obj.uns[‘Pseudobulk’][variable][‘Expression’]
nr_cells (int, optional) – Number of cells to include per pseudobulk.
nr_pseudobulks (int, optional) – Number of pseudobulks to generate per class
seed (int) – Seed to ensure that pseudobulk are reproducible.
- scenicplus.cistromes.merge_cistromes(scplus_obj: scenicplus.scenicplus_class.SCENICPLUS, cistromes_key: str = 'Unfiltered', subset: Optional[pyranges.pyranges.PyRanges] = None)[source]
Generate cistromes from motif enrichment tables
- Parameters
scplus_obj (
SCENICPLUS
) – ASCENICPLUS
object with motif enrichment results from pycistarget (scplus_obj.menr). Several analyses can be included in the slot (topics/DARs/other; and different methods [Homer/DEM/cistarget]).cistromes_key (str, optional) – Key to store cistromes. Cistromes will stored at scplus_obj.uns[‘Cistromes’][siganture_key]
subset (list) – A PyRanges containing a set of regions that regions in cistromes must overlap. This is useful when aiming for cell type specific cistromes for example (e.g. providing the cell type’s MACS peaks)
- scenicplus.cistromes.prune_plot(scplus_obj: scenicplus.scenicplus_class.SCENICPLUS, name: str, pseudobulk_variable: Optional[str] = None, auc_key: str = 'Cistromes_AUC', signature_key: str = 'Unfiltered', use_pseudobulk: bool = True, show_dot_plot: bool = True, show_line_plot: bool = False, color_dict=None, subset=None, seed=555, ax: Optional[matplotlib.pyplot.axes] = None, **kwargs)[source]
Plot cistrome accessibility versus TF expression
- Parameters
scplus_obj (
SCENICPLUS
) – ASCENICPLUS
object.cistrome_name (str, optional) – Cistrome to plot. The TF name (or followed by extended) is enough to quert.
pseudobulk_variable (str, optional) – Key to retrieve the pseudobulk matrices. Cistrome accessibility will be retrieved from scplus_obj.uns[‘Pseudobulk’][pseudobulk_variable][‘Cistromes_AUC’][cistromes_key] and gene expression from scplus_obj.uns[‘Pseudobulk’][pseudobulk_variable][‘Expression’].
cistromes_key (str, optional) – Key to retrieve the pseudobulk matrices. Cistrome accessibility will be retrieved from scplus_obj.uns[‘Pseudobulk’][pseudobulk_variable][‘Cistromes_AUC’][cistromes_key] and gene expression from scplus_obj.uns[‘Pseudobulk’][pseudobulk_variable][‘Expression’].
use_pseudobulk (bool, optional) – Whether to use pseudobulk matrix or actual values.
show_dot_plot (bool, optional) – Whether to show dots in plot
show_line_plot (bool, optional) – Whether to show line fitting to plot
color_dict (Dict, optional) – Color dictionary to specify colors
subset (List, optional) – Subset of pseudobulks/cells to use
seed (int) – Seed to ensure that pseudobulk are reproducible.
ax (plt.axes, optional) – matplotlib axes to plot to.
**kwargs – Parameters for seaborn plotting.
- scenicplus.cistromes.score_cistromes(scplus_obj: scenicplus.scenicplus_class.SCENICPLUS, ranking: pycisTopic.diff_features.CistopicImputedFeatures, cistromes_key: str = 'Unfiltered', enrichment_type: str = 'region', auc_threshold: float = 0.05, normalize: bool = False, n_cpu: int = 1)[source]
Get enrichment of a region signature in cells using AUCell (Van de Sande et al., 2020)
- Parameters
scplus_obj (
SCENICPLUS
) – ASCENICPLUS
object with motif enrichment results from pycistarget (scplus_obj.menr).rankings (CistopicImputedFeatures) – A CistopicImputedFeatures object with ranking values
cistromes_key (str, optional) – Key to store where cistromes are stored. Cistromes will retrieved from scplus_obj.uns[‘Cistromes’][siganture_key] and AUC values will be stored in scplus_obj.uns[‘Cistromes_AUC’][cistromes_key].
enrichment_type (str) – Whether features are genes or regions
auc_threshold (float) – The fraction of the ranked genome to take into account for the calculation of the Area Under the recovery Curve. Default: 0.05
normalize (bool) – Normalize the AUC values to a maximum of 1.0 per regulon. Default: False
num_workers (int) – The number of cores to use. Default: 1
References
Van de Sande, B., Flerin, C., Davie, K., De Waegeneer, M., Hulselmans, G., Aibar, S., … & Aerts, S. (2020). A scalable SCENIC workflow for single-cell gene regulatory network analysis. Nature Protocols, 15(7), 2247-2276.
Enhancer-to-gene linking
Link enhancers to genes based on co-occurence of chromatin accessbility of the enhancer and gene expression.
Both linear methods (spearman or pearson correlation) and non-linear methods (random forrest or gradient boosting) are used to link enhancers to genes.
The correlation methods are used to seperate regions which are infered to have a positive influence on gene expression (i.e. positive correlation) and regions which are infered to have a negative influence on gene expression (i.e. negative correlation).
- scenicplus.enhancer_to_gene.calculate_regions_to_genes_relationships(SCENICPLUS_obj: scenicplus.scenicplus_class.SCENICPLUS, search_space_key: str = 'search_space', mask_expr_dropout: bool = False, genes: Optional[List[str]] = None, importance_scoring_method: str = 'GBM', importance_scoring_kwargs: dict = {'learning_rate': 0.01, 'max_features': 0.1, 'n_estimators': 500}, correlation_scoring_method: str = 'SR', ray_n_cpu: Optional[int] = None, add_distance: bool = True, key_added: str = 'region_to_gene', inplace: bool = True, **kwargs)[source]
Calculates region to gene relationships using non-linear regression methods and correlation
- Parameters
- SCENICPLUS_obj: SCENICPLUS
instance of SCENICPLUS class containing expression data and chromatin accessbility data
- search_space_key: str = ‘search_space’
a key in SCENICPLUS_obj.uns.keys pointing to a dataframe containing the search space surounding each gene.
- mask_expr_dropout: bool = False
Wether or not to exclude cells which have zero counts for a gene from the calculations
- genes: List[str] None
list of genes for which to calculate region gene scores. Default is None, i.e. all genes
- importance_scoring_method: str = GBM
method used to score region to gene importances. Available regression analysis are: ‘RF’ (Random Forrest regression), ‘ET’ (Extra Trees regression), ‘GBM’ (Gradient Boostin regression).
- importance_scoring_kwargs: dict = GBM_KWARGS
arguments to pass to the importance scoring function
- correlation_scoring_method: str = SR
method used to calculate region to gene correlations. Available correlation analysis are: ‘PR’ (pearson correlation), ‘SR’ (spearman correlation).
- ray_n_cpu: int = None
number of cores to use for ray multi-processing. Does not use ray when set to None
- add_distance: bool = True
Wether or not to return region to gene distances
- key_added: str = region_to_gene
Key in SCENICPLUS_obj.uns under which to store region to gene links, only stores when inplace = True
- inplace: bool = True
Wether or not store the region to gene links in the SCENICPLUS_obj, if False a pd.DataFrame will be returned.
- scenicplus.enhancer_to_gene.export_to_UCSC_interact(SCENICPLUS_obj: scenicplus.scenicplus_class.SCENICPLUS, species: str, outfile: str, region_to_gene_key: str = ' region_to_gene', pbm_host: str = 'http://www.ensembl.org', bigbed_outfile: Optional[str] = None, path_bedToBigBed: Optional[str] = None, assembly: Optional[str] = None, ucsc_track_name: str = 'region_to_gene', ucsc_description: str = 'interaction file for region to gene', cmap_neg: str = 'Reds', cmap_pos: str = 'Greens', key_for_color: str = 'importance', vmin: int = 0, vmax: int = 1, scale_by_gene: bool = True, subset_for_eRegulons_regions: bool = True, eRegulons_key: str = 'eRegulons') pandas.core.frame.DataFrame [source]
Exports interaction dataframe to UCSC interaction file and (optionally) UCSC bigInteract file.
- Parameters
- SCENICPLUS_obj: SCENICPLUS
An instance of class scenicplus_class.SCENICPLUS containing region to gene links in .uns.
- species: str
Species corresponding to your datassets (e.g. hsapiens)
- outfile: str
Path to output file
- region_to_gene_key: str =’ region_to_gene’
Key in SCENICPLUS_obj.uns.keys() under which to find region to gene links.
- pbm_host:str = ‘http://www.ensembl.org’
Url of biomart host relevant for your assembly.
- bigbed_outfile:str = None
Path to which to write the bigbed output.
- path_bedToBigBed: str= None
Path to bedToBigBed program, used to convert bed file to bigbed format. Can be downloaded from http://hgdownload.soe.ucsc.edu/admin/exe/linux.x86_64/bedToBigBed
- assembly: str = None
String identifying the assembly of your dataset (e.g. hg39).
- ucsc_track_name: str = ‘region_to_gene’
Name of the exported UCSC track
- ucsc_description: str = ‘interaction file for region to gene’
Description of the exported UCSC track
- cmap_neg: str = ‘Reds’
Matplotlib colormap used to color negative region to gene links.
- cmap_pos: str = ‘Greens’
Matplotlib colormap used to color positive region to gene links.
- key_for_color: str = ‘importance’
Key pointing to column in region to gene links used to map cmap colors to.
- vmin: int = 0
vmin of region to gene link colors.
- vmax: int = 1
vmax of region to gene link colors.
- scale_by_gene: bool = True
Boolean specifying wether to scale importance scores of regions linking to the same gene from 0 to 1
- subset_for_eRegulons_regions: bool = True
Boolean specifying wether or not to subset region to gene links for regions and genes in eRegulons.
- eRegulons_key: str = ‘eRegulons’
key in SCENICPLUS_obj.uns.keys() under which to find eRegulons.
- Returns
- pd.DataFrame with region to gene links formatted in the UCSC interaction format.
- scenicplus.enhancer_to_gene.get_search_space(SCENICPLUS_obj: scenicplus.scenicplus_class.SCENICPLUS, species=None, assembly=None, pr_annot=None, pr_chromsizes=None, predefined_boundaries=None, use_gene_boundaries=False, upstream=[1000, 150000], downstream=[1000, 150000], extend_tss=[10, 10], remove_promoters=False, biomart_host='http://www.ensembl.org', inplace=True, key_added='search_space', implode_entries=True)[source]
Get search space surrounding genes to calculate enhancer to gene links
- Parameters
- SCENICPLUS_obj: SCENICPLUS
a
pr.SCENICPLUS
.- species: string, optional
Name of the species (e.g. hsapiens) on whose reference genome the search space should be calculated. This will be used to retrieve gene annotations from biomart. Annotations can also be manually provided using the parameter [pr_annot]. Default: None
- assembly: string, optional
Name of the assembly (e.g. hg38) of the reference genome on which the search space should be calculated. This will be used to retrieve chromosome sizes from the UCSC genome browser. Chromosome sizes can also be manually provided using the parameter [pr_chromsizes]. Default: None
- pr_annot: pr.PyRanges, optional
A
pr.PyRanges
containing gene annotation, including Chromosome, Start, End, Strand (as ‘+’ and ‘-‘), Gene name and Transcription Start Site. Default: None- pr_chromsizes: pr.PyRanges, optional
A
pr.PyRanges
containing size of each chromosome, containing ‘Chromosome’, ‘Start’ and ‘End’ columns. Default: None- predefined_boundaries: pr.PyRanges, optional
A
pr.PyRanges
containing predefined genomic domain boundaries (e.g. TAD boundaries) to use as boundaries. If given, use_gene_boundaries will be ignored.- use_gene_boundaries: bool, optional
Whether to use the whole search space or stop when encountering another gene. Default: False
- upstream: List, optional
Search space upstream. The minimum (first position) means that even if there is a gene right next to it these bp will be taken. The second position indicates the maximum distance. Default: [1000, 100000]
- downstream: List, optional
Search space downstream. The minimum (first position) means that even if there is a gene right next to it these bp will be taken. The second position indicates the maximum distance. Default: [1000, 100000]
- extend_tss: list, optional
Space around the TSS consider as promoter. Default: [10,10]
- remove_promoters: bool, optional
Whether to remove promoters from the search space or not. Default: False
- biomart_host: str, optional
Biomart host to use to download TSS annotation. Please make sure this host matches the expression data (i.e. matching gene names) otherwise a lot of genes are potentially lost.
- inplace: bool, optional
If set to True, store results into scplus_obj, otherwise return results.
- key_added: str, optional
Key under which to add the results under scplus.uns.
- implode_entries: bool, optional
When a gene has multiple start/end sites it has multiple distances and gene width. If this parameter is set to True these multiple entries per region and gene will be put in a list, generating a single entry. If this parameter is set to False these multiple entries will be kept.
- Return
- ——
- pd.DataFrame
A data frame containing regions in the search space for each gene
TF-to-gene linking
Link transcription factors (TFs) to genes based on co-expression of TF and target genes.
Both linear methods (spearman or pearson correlation) and non-linear methods (random forrest or gradient boosting) are used to link TF to genes.
The correlation methods are used to seperate TFs which are infered to have a positive influence on gene expression (i.e. positive correlation) and TFs which are infered to have a negative influence on gene expression (i.e. negative correlation).
- scenicplus.TF_to_gene.calculate_TFs_to_genes_relationships(scplus_obj: scenicplus.scenicplus_class.SCENICPLUS, tf_file: str, method: str = 'GBM', ray_n_cpu: int = 1, key: str = 'TF2G_adj', **kwargs)[source]
A function to calculate TF to gene relationships using arboreto and correlation
- Parameters
- scplus_obj
An instance of
SCENICPLUS
- tf_file
Path to a file specifying with genes are TFs
- method
Whether to use Gradient Boosting Machines (GBM) or random forest (RF)
- ray_n_cpu
Number of cpus to use
- key
String specifying where in the .uns slot to store the adjacencies matrix in :param:`SCENICPLUS_obj` default: “TF2G_adj”
- **kwargs
Parameters to pass to ray.init
- scenicplus.TF_to_gene.load_TF2G_adj_from_file(SCENICPLUS_obj: scenicplus.scenicplus_class.SCENICPLUS, f_adj: str, inplace=True, key='TF2G_adj', rho_threshold=0.03)[source]
Function to load TF2G adjacencies from file
- Parameters
- SCENICPLUS_obj
An instance of
SCENICPLUS
- f_adj
File path to TF2G adjacencies matrix
- inplace
Boolean specifying wether or not to store adjacencies matrix in SCENICPLUS_obj under slot .uns[key]. Default: True
- key_added
String specifying where in the .uns slot to store the adjacencies matrix in SCENICPLUS_obj Default: “TF2G_adj”
- rho_threshold
A floating point number specifying from which absolute value to consider a correlation coefficient positive or negative. Default: 0.03
eGRN building
eRegulon Class
eRegulon class stores the transcription factor together with its target regions and genes.
- scenicplus.grn_builder.modules.create_emodules(SCENICPLUS_obj: scenicplus.scenicplus_class.SCENICPLUS, region_to_gene_key: str = 'region_to_gene', cistromes_key: str = 'Unfiltered', order_regions_to_genes_by: str = 'importance', quantiles: tuple = (0.85, 0.9), top_n_regionTogenes_per_gene: tuple = (5, 10, 15), top_n_regionTogenes_per_region: tuple = (), binarize_using_basc: bool = False, min_regions_per_gene: int = 0, rho_dichotomize: bool = True, keep_only_activating: bool = False, rho_threshold: float = 0.03, keep_extended_motif_annot: bool = False, disable_tqdm=False, ray_n_cpu=None, **kwargs) Tuple[List[str], List[scenicplus.grn_builder.modules.eRegulon]] [source]
A function to create e_modules of :class: ~scenicplus.grn_builder.modules.eRegulon. This function will binarize region-to-gene links using various parameters and couples these links to a TF based on infromation in the motif enrichment (menr) field of the
SCENICPLUS_obj
.- Parameters
- SCENICPLUS_obj
An instance of :class: ~scenicplus.scenicplus_class.SCENICPLUS, containing motif enrichment data under the slot .menr.
- region_to_gene_key
A key specifying under which to find region-to-gene links in the .uns slot of SCENICPLUS_obj. Default: “region_to_gene”
- cistromes_key
A key specifying which cistromes to use in .uns[‘Cistromes’] slot of SCENICPLUS_obj
- quantiles
A tuple specifying the quantiles used to binarize region-to-gene links Default: (0.85, 0.90)
- top_n_regionTogenes_per_gene
A tuple specifying the top n region-to-gene links to take PER GENE in order to binarize region-to-gene links. Default: (5, 10, 15)
- top_n_regionTogenes_per_region
A tuple specifying the top n region-to-gene links to take PER REGION in order to binarize region-to-gene links. Default: ()
- binarize_using_basc:
A boolean specifying wether or not to binarize region-to-gene links using BASC. Hopfensitz M, et al.
- min_regions_per_gene:
An integer specifying a lower limit on regions per gene (after binarization) to consider for further analysis. Default: 0
- rho_dichotomize:
A boolean specifying wether or not to split region-to-gene links based on postive/negative correlation coefficients. default: True
- keep_only_activating:
A boolean specifying wether or not to only retain region-to-gene links with a positive correlation coefficient. default: False
- rho_threshold:
A floating point number specifying from which absolute value to consider a correlation coefficient positive or negative. default: 0.03
- keep_extended_motif_annot
A boolean specifying wether or not keep extended motif annotations for further analysis. default: False
- ray_n_cpu
An integer specifying the number of parallel cores to use to binarize region to gene links default: None (i.e. run using single core)
- **kwargs
Extra keyword arguments passed to ray.init function
- Returns
- A set of relevant TFs, A list of :class: ~scenicplus.grn_builder.modules.eRegulon.
References
Hopfensitz M, et al. Multiscale binarization of gene expression data for reconstructing Boolean networks. IEEE/ACM Trans Comput Biol Bioinform. 2012;9(2):487-98.
- class scenicplus.grn_builder.modules.eRegulon(transcription_factor: str, cistrome_name: str, is_extended: bool, regions2genes: List[collections.namedtuple], context=frozenset({}), in_leading_edge: Optional[List[bool]] = None, gsea_enrichment_score: Optional[float] = None, gsea_pval: Optional[float] = None, gsea_adj_pval: Optional[float] = None)[source]
An eRegulon is a gene signature that defines the target regions and genes of a Transcription Factor (TF).
- Parameters
- transcription_factor
A string specifying the transcription factor of the eRegulon
- cistrome_name
A string specifying the cistrome name
- is_extended
A boolean specifying wether the cistromes comes from an extended annotation or not
- regions2genes
A list of named tuples containing information on region-to-gene links (region, gene, importance score, correlation coefficient)
- context
The context in which this eRegulon was created (this can be different threshold, activating / repressing, …). default: frozenset()
- in_leading_edge
A list specifying which genes are in the leading edge of a gsea analysis. default: None
- gsea_enrichment_score
A float containing the enrichment score of a gsea analysis. default: None
- gsea_pval
A float containing the p value of a gsea analysis. default: None
- gsea_adj_pval
A float containing an adjusted p value of a gsea analysis. default: None
- Attributes
target_genes
Return target genes of this eRegulon.
target_regions
Return target regions of this eRegulon.
n_target_genes
Return number of target genes.
n_target_regions
Return number of target regions.
Methods
subset_leading_edge
([inplace])Subset eReglon on leading edge.
- property n_target_genes
Return number of target genes.
- property n_target_regions
Return number of target regions.
- subset_leading_edge(inplace=True)[source]
Subset eReglon on leading edge.
- Parameters
inplace – if set to True update eRegulon else return new eRegulon after subset.
- property target_genes
Return target genes of this eRegulon.
- property target_regions
Return target regions of this eRegulon.
- scenicplus.grn_builder.modules.merge_emodules(SCENICPLUS_obj: Optional[scenicplus.scenicplus_class.SCENICPLUS] = None, e_modules: Optional[list] = None, e_modules_key: str = 'eRegulons', rho_dichotomize: bool = True, key_to_add: str = 'eRegulons', inplace: bool = True)[source]
Function to merge list of
eRegulon
- Parameters
- SCENICPLUS_obj
An instance of :class: ~scenicplus.scenicplus_class.SCENICPLUS, containing eRegulons in slot .uns. default: None
- e_modules
A list of
eRegulon
. default: None- e_modules_key
A string key specifying where to find a list of
eRegulon
under .uns slot of`SCENICPLUS_obj`. default: “eRegulons”- rho_dichotomize
A boolean specifying wether or not to split region-to-gene links based on postive/negative correlation coefficients. default: True
- key_to_add
A string key specifying where to store the list of merged
eRegulon
in the .uns slot of SCENICPLUS_obj.- inplace
A boolean if set to True update the SCENICPLUS_obj otherwise return list of merged
eRegulon
GSEA based approach

Generate enhancer drive GRNs (eGRS) using the GSEA approach.
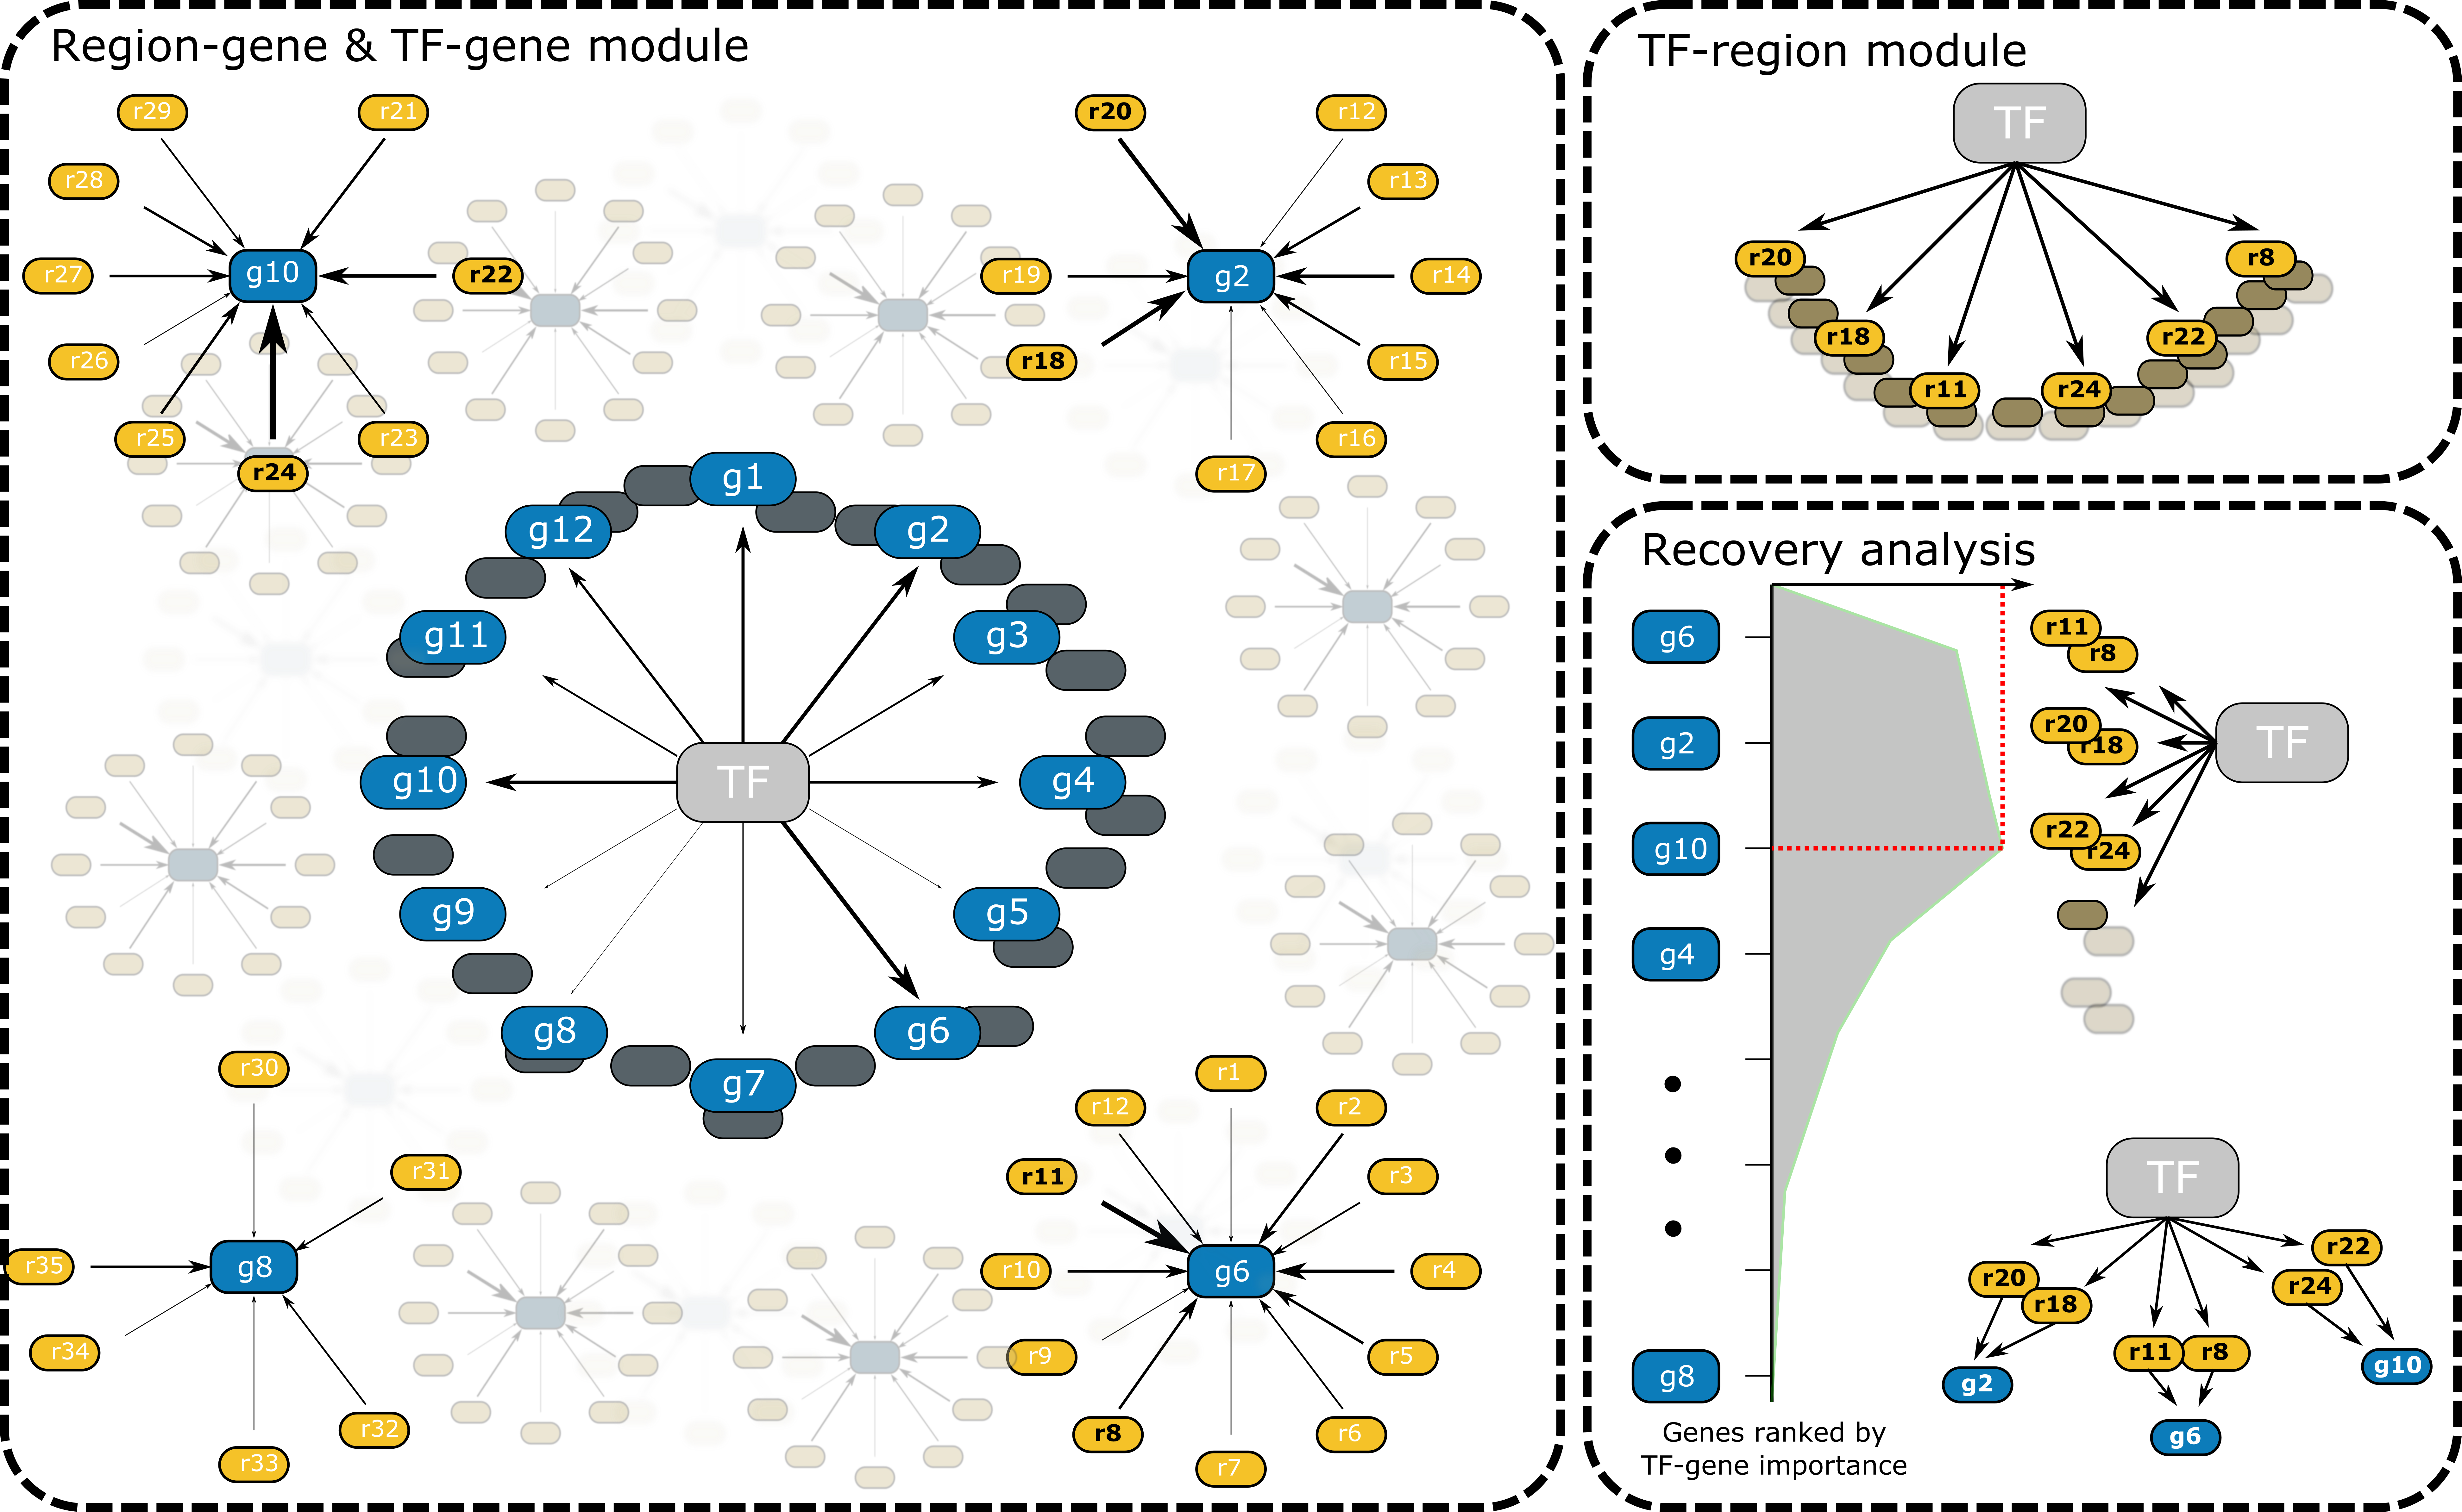
Using this approach we will test if the gene set obtained from region-to-gene links, where the regions have a high score for a motif of a certain TF (region indicated in black in the diagram: r8, r11, r18, r20, r22, r24), are enriched in the top of the ranking based on the TF-to-gene links of the same TF (bottom right panel).
Only genes, from the set, and the regions linked to these genes in the top of the ranking (i.e. leading edge) will be kept.
This aproach is done seperatly for positive and negative TF and region to gene links.
Generating following four combinations:
TF-to-gene relationship |
region-to-gene relationship |
biological role |
---|---|---|
positive (+) |
positive (+) |
TF opens chromatin and activates gene expression |
positive (+) |
negative (-) |
When the TF is expressed the target gene is also expressed but the regions linked to the gene are closed. |
negative (-) |
positive (+) |
When the TF is expressed the target gene is not expressed. When the target gene is expressed, regions linked to this gene are open. TF could be a chromatin closing repressor. |
negative (-) |
negative (-) |
When the TF is expressed the target gene is not expressed. When the target gene is expressed, regions linked to this gene are closed. |
Left panel indicates the TF-to-gene links (blue) and region-to-gene links (yellow). Witdh of arrows correspond the strength of the connections based on non-linear regression.
Top right panel indicates regions with a high score for a motif of a TF
Bottom right panel shows GSEA analysis, with on the left genes ranked by TF-to-gene connection strength and on the right the gene-set obtained from region-to-gene links. In the diagram: g2, g6, and g10 are located in the top of the TF-to-gene ranking (i.e. leading edge), only these genes and the regions linked to these genes: r20, r18, r11, r8, r24 and r22 will be kept.
- scenicplus.grn_builder.gsea_approach.build_grn(SCENICPLUS_obj: scenicplus.scenicplus_class.SCENICPLUS, adj_key='TF2G_adj', cistromes_key='Unfiltered', region_to_gene_key='region_to_gene', order_regions_to_genes_by='importance', order_TFs_to_genes_by='importance', gsea_n_perm=1000, quantiles=(0.85, 0.9), top_n_regionTogenes_per_gene=(5, 10, 15), top_n_regionTogenes_per_region=(), binarize_using_basc=False, min_regions_per_gene=0, rho_dichotomize_tf2g=True, rho_dichotomize_r2g=True, rho_dichotomize_eregulon=True, keep_only_activating=False, rho_threshold=0.03, NES_thr=0, adj_pval_thr=1, min_target_genes=5, inplace=True, key_added='eRegulons', ray_n_cpu=None, merge_eRegulons=True, keep_extended_motif_annot=False, disable_tqdm=False, **kwargs)[source]
Build GRN using GSEA approach
- Parameters
SCENICPLUS_obj – An instance of :class: ~scenicplus.scenicplus_class.SCENICPLUS
adj_key – Key under which to find TF2G adjacencies default: “TF2G_adj”
region_to_gene_key – Key under which to find R2G adjacnecies default: “region_to_gene”
gsea_n_perm – Int specifying number of gsea permutations to run for p value calculation default: 1000
quantiles – A tuple specifying the quantiles used to binarize region-to-gene links Default: (0.85, 0.90)
top_n_regionTogenes_per_gene – A tuple specifying the top n region-to-gene links to take PER GENE in order to binarize region-to-gene links. Default: (5, 10, 15)
top_n_regionTogenes_per_region – A tuple specifying the top n region-to-gene links to take PER REGION in order to binarize region-to-gene links. Default: ()
binarize_using_basc – A boolean specifying wether or not to binarize region-to-gene links using BASC. Hopfensitz M, et al.
min_regions_per_gene – An integer specifying a lower limit on regions per gene (after binarization) to consider for further analysis. Default: 0
rho_dichotomize – A boolean specifying wether or not to split region-to-gene links based on postive/negative correlation coefficients. default: True
keep_only_activating – A boolean specifying wether or not to only retain region-to-gene links with a positive correlation coefficient. default: False
rho_threshold – A floating point number specifying from which absolute value to consider a correlation coefficient positive or negative. default: 0.03
NES_thr – Float specifying threshold on gsea NES value defaut: 0
adj_pval_thr – Float specifying threshold on gsea adjusted p value default: 1
min_target_genes – Int specifying minumum number of target genes in leading edge default: 5
inplace – Boolean specifying wether to store results in SCENICPLUS_obj default: True
key_added – Key specifying in under which key to store result in SCENICPLUS_obj.uns default: “eRegulons”
ray_n_cpu – Int specifying number of cores to use default: None
merge_eRegulons – Boolean specifying wether to merge eRegulons form the same TF but different thresholding approaches default: True
keep_extended_motif_annot – A boolean specifying wether or not keep extended motif annotations for further analysis. default: False
**kwargs – Additional keyword arguments passed to ray.init
References
Hopfensitz M, et al. Multiscale binarization of gene expression data for reconstructing Boolean networks. IEEE/ACM Trans Comput Biol Bioinform. 2012;9(2):487-98.
Downstream analysis, export and plotting
Marker genes and regions
Calculate differentially expressed genes (DEGs) and differentially accessible regions (DARs).
- scenicplus.diff_features.get_differential_features(scplus_obj: scenicplus.scenicplus_class.SCENICPLUS, variable, use_hvg: Optional[bool] = True, contrast_type: Optional[List] = ['DARs', 'DEGs'], adjpval_thr: Optional[float] = 0.05, log2fc_thr: Optional[float] = 0.5849625007211562, min_cells: Optional[int] = 2)[source]
Get DARs of DEGs given reference variable.
- Parameters
scplus_obj (class::SCENICPLUS) – A SCENICPLUS object.
variable (str) – Variable to compute DARs/DEGs by (has to be included in scplus_obj.metadata_cell)
use_hvg (bool, optional) – Whether to use only highly variable genes/regions
contrast_type (list, optional) – Wheter to compute DARs and/or DEGs per variable
adjpval_thr (float, optional) – P-value threshold
log2fc_thr – Log2FC threshold
eRegulon enrichment in cells
Score eRegulon target genes and regions in cells using AUC algorithm.
- scenicplus.eregulon_enrichment.binarize_AUC(scplus_obj: scenicplus.scenicplus_class.SCENICPLUS, auc_key: Optional[str] = 'eRegulon_AUC', out_key: Optional[str] = 'eRegulon_AUC_thresholds', signature_keys: Optional[List[str]] = ['Gene_based', 'Region_based'], n_cpu: Optional[int] = 1)[source]
Binarize eRegulons using AUCell
- Parameters
- scplus_obj: `class::SCENICPLUS`
A SCENICPLUS object with eRegulons AUC.
- auc_key: str, optional
Key where the AUC values are stored
- out_key: str, optional
Key where the AUCell thresholds will be stored (in scplus_obj.uns)
- signature_keys: List, optional
Keys to extract AUC values from. Default: [‘Gene_based’, ‘Region_based’]
- n_cpu: int
The number of cores to use. Default: 1
- scenicplus.eregulon_enrichment.get_eRegulons_as_signatures(scplus_obj: scenicplus.scenicplus_class.SCENICPLUS, eRegulon_metadata_key: str = 'eRegulon_metadata', key_added: str = 'eRegulon_signatures')[source]
Format eRegulons for scoring
- Parameters
- scplus_obj: `class::SCENICPLUS`
A SCENICPLUS object with eRegulons metadata computed.
- eRegulon_metadata_key: str, optional
Key where the eRegulon metadata is stored (in scplus_obj.uns)
- key_added: str, optional
Key where formated signatures will be stored (in scplus_obj.uns)
- scenicplus.eregulon_enrichment.make_rankings(scplus_obj: scenicplus.scenicplus_class.SCENICPLUS, target: str = 'region', seed: int = 123)[source]
A function to generate rankings per cell based on the imputed accessibility scores per region or the gene expression per cell.
- Parameters
scplus_obj (
SCENICPLUS
) – ASCENICPLUS
object with motif enrichment results from pycistarget (scplus_obj.menr).target (str, optional) – Whether rankings should be done based on gene expression or region accessibilty. Default: ‘region’
seed (int, optional) – Random seed to ensure reproducibility of the rankings when there are ties
- scenicplus.eregulon_enrichment.score_eRegulons(scplus_obj: scenicplus.scenicplus_class.SCENICPLUS, ranking: pycisTopic.diff_features.CistopicImputedFeatures, inplace: bool = True, eRegulon_signatures_key: str = 'eRegulon_signatures', key_added: str = 'eRegulon_AUC', enrichment_type: str = 'region', auc_threshold: float = 0.05, normalize: bool = False, n_cpu: int = 1)[source]
Score eRegulons using AUCell
- Parameters
- scplus_obj: `class::SCENICPLUS`
A SCENICPLUS object with formatted eRegulons.
- ranking: `class::CistopicImputedFeatures`
A CistopicImputedFeatures object containing rankings, generated using the function make_rankings.
- inplace: bool, optional
If set to True store result in scplus_obj, otherwise it is returned.
- eRegulon_signatures_key: str, optional
Key where formated signatures are stored (in scplus_obj.uns)
- key_added: str, optional
Key where formated AUC values will be stored (in scplus_obj.uns)
- enrichment_type: str, optional
Whether region or gene signatures are being used
- auc_threshold: float
The fraction of the ranked genome to take into account for the calculation of the Area Under the recovery Curve. Default: 0.05
- normalize: bool
Normalize the AUC values to a maximum of 1.0 per regulon. Default: False
- n_cpu: int
The number of cores to use. Default: 1
dimensionality reduction
Dimmensionality reduction and clustering based on target genes and target regions AUC.
- scenicplus.dimensionality_reduction.find_clusters(scplus_obj: scenicplus.scenicplus_class.SCENICPLUS, auc_key: Optional[str] = 'eRegulon_AUC', signature_keys: Optional[List[str]] = ['Gene_based', 'Region_based'], k: Optional[int] = 10, res: Optional[List[float]] = [0.6], seed: Optional[int] = 555, scale: Optional[bool] = True, prefix: Optional[str] = '', selected_regulons: Optional[List[int]] = None, selected_cells: Optional[List[str]] = None, **kwargs)[source]
Performing leiden cell or region clustering and add results to SCENICPLUS object’s metadata.
- Parameters
scplus_obj (class::SCENICPLUS) – A SCENICPLUS object with eRegulons AUC computed.
auc_key (str, optional) – Key to extract AUC values from. Default: ‘eRegulon_AUC’
signature_keys (List, optional) – Keys to extract AUC values from. Default: [‘Gene_based’, ‘Region_based’]
k (int, optional) – Number of neighbours in the k-neighbours graph. Default: 10
res (float, optional) – Resolution parameter for the leiden algorithm step. Default: 0.6
seed (int, optional) – Seed parameter for the leiden algorithm step. Default: 555
scale (bool, optional) – Whether to scale the enrichment prior to the clustering. Default: False
prefix (str, optional) – Prefix to add to the clustering name when adding it to the correspondent metadata attribute. Default: ‘’
selected_regulons (list, optional) – A list with selected regulons to be used for clustering. Default: None (use all regulons)
selected_cells (list, optional) – A list with selected features cells to cluster. Default: None (use all cells)
- scenicplus.dimensionality_reduction.harmony(scplus_obj: scenicplus.scenicplus_class.SCENICPLUS, variable: str, auc_key: str = 'eRegulon_AUC', out_key: str = 'eRegulon_AUC_harmony', signature_keys: List[str] = ['Gene_based', 'Region_based'], scale: Optional[bool] = True, random_state: Optional[int] = 555, **kwargs)[source]
Apply harmony batch effect correction (Korsunsky et al, 2019) over eRegulon AUC values :param scplus_obj: A SCENICPLUS object with eRegulon AUC values calculated. :type scplus_obj: class::SCENICPLUS :param variable: Variable in scplus.metadata_cell to correct by. :type variable: str :param auc_key: Key where AUC values are stored. :type auc_key: str, optional :param out_key: Key where corrected eRegulon values will be output :type out_key: str, optional :param signature_keys: Whether to scale probability matrix prior to correction. Default: True :type signature_keys: list, optional :param scale: Whether to scale the AUC values :type scale: bool, optional :param random_state: Random seed used to use with harmony. Default: 555 :type random_state: int, optional
References
Korsunsky, I., Millard, N., Fan, J., Slowikowski, K., Zhang, F., Wei, K., … & Raychaudhuri, S. (2019). Fast, sensitive and accurate integration of single-cell data with Harmony. Nature methods, 16(12), 1289-1296.
- scenicplus.dimensionality_reduction.plot_AUC_given_ax(scplus_obj: scenicplus.scenicplus_class.SCENICPLUS, reduction_name: str, feature: str, ax: <module 'matplotlib.axes' from '/home/docs/checkouts/readthedocs.org/user_builds/scenicplus/envs/latest/lib/python3.8/site-packages/matplotlib/axes/__init__.py'>, auc_key: str = 'eRegulon_AUC', signature_key: str = 'Gene_based', cmap: <module 'matplotlib.cm' from '/home/docs/checkouts/readthedocs.org/user_builds/scenicplus/envs/latest/lib/python3.8/site-packages/matplotlib/cm.py'> = <matplotlib.colors.ListedColormap object>, dot_size: int = 10, alpha: float = 1, scale: bool = False, selected_cells: typing.Optional[typing.List] = None)[source]
Plot eRegulon AUC values on dimmensionality reduction
- Parameters
- scplus_obj: `class::SCENICPLUS`
A SCENICPLUS object with dimensionality reductions.
- reduction_name: str
Name of the dimensionality reduction to use.
- feature: str
eRegulon to plot, should be included in scplus_obj.uns[auc_key][signature_key] matrix.
- ax: matplotlib.axes
matplotlib axes to which to plot.
- auc_key: str, optional
key in scplus_obj.uns under which the AUC values are stored
- signature_key: str, optional
key in scplus_obj.uns[auc_key] to plot (usually Gene_based or Region_based)
- cmap: matplotlib.cm, optional
color map to use for plotting.
- dot_size: int, optional
Dot size in the plot. Default: 10
- alpha: float, optional
Transparency value for the dots in the plot. Default: 1
- scale: bool, optional
Wether to scale AUC values before plotting
- selected_cells: List, optional
A list with selected cells to plot.
- scenicplus.dimensionality_reduction.plot_eRegulon(scplus_obj: scenicplus.scenicplus_class.SCENICPLUS, reduction_name: str, auc_key: typing.Optional[str] = 'eRegulon_AUC', signature_keys: typing.Optional[typing.List[str]] = ['Gene_based', 'Region_based'], normalize_tf_expression: typing.Optional[bool] = True, cmap: typing.Optional[typing.Union[str, matplotlib.cm]] = <matplotlib.colors.ListedColormap object>, dot_size: typing.Optional[int] = 10, alpha: typing.Optional[typing.Union[float, int]] = 1, scale: typing.Optional[bool] = False, selected_regulons: typing.Optional[typing.List[int]] = None, selected_cells: typing.Optional[typing.List[str]] = None, figsize: typing.Optional[typing.Tuple[float, float]] = (6.4, 4.8), num_columns: typing.Optional[int] = 3, save: typing.Optional[str] = None)[source]
Plot TF expression and eRegulon AUC (gene and region based) into dimensionality reduction.
- Parameters
scplus_obj (class::SCENICPLUS) – A cisTopic object with dimensionality reductions in class::CistopicObject.projections.
reduction_name (str) – Name of the dimensionality reduction to use
auc_key (str, optional) – Key to extract AUC values from. Default: ‘eRegulon_AUC’
signature_keys (List, optional) – Keys to extract AUC values from. Default: [‘Gene_based’, ‘Region_based’]
normalize_tf_expression (bool, optional) – Whether logCPM normalize TF expression. Default: True
cmap (str or 'matplotlib.cm', optional) – For continuous variables, color map to use for the legend color bar. Default: cm.viridis
dot_size (int, optional) – Dot size in the plot. Default: 10
alpha (float, optional) – Transparency value for the dots in the plot. Default: 1
scale (bool, optional) – Whether to scale the cell-topic or topic-regions contributions prior to plotting. Default: False
selected_regulons (list, optional) – A list with selected regulons to be used for clustering. Default: None (use all regulons)
selected_cells (list, optional) – A list with selected features cells to cluster. Default: None (use all cells)
figsize (tuple, optional) – Size of the figure. If num_columns is 1, this is the size for each figure; if num_columns is above 1, this is the overall size of the figure (if keeping default, it will be the size of each subplot in the figure). Default: (6.4, 4.8)
num_columns (int, optional) – For multiplot figures, indicates the number of columns (the number of rows will be automatically determined based on the number of plots). Default: 1
save (str, optional) – Path to save plot. Default: None.
- scenicplus.dimensionality_reduction.plot_metadata(scplus_obj: scenicplus.scenicplus_class.SCENICPLUS, reduction_name: str, variables: typing.List[str], remove_nan: typing.Optional[bool] = True, show_label: typing.Optional[bool] = True, show_legend: typing.Optional[bool] = False, cmap: typing.Optional[typing.Union[str, matplotlib.cm]] = <matplotlib.colors.ListedColormap object>, dot_size: typing.Optional[int] = 10, text_size: typing.Optional[int] = 10, alpha: typing.Optional[typing.Union[float, int]] = 1, seed: typing.Optional[int] = 555, color_dictionary: typing.Optional[typing.Dict[str, str]] = {}, figsize: typing.Optional[typing.Tuple[float, float]] = (6.4, 4.8), num_columns: typing.Optional[int] = 1, selected_cells: typing.Optional[typing.List[str]] = None, save: typing.Optional[str] = None)[source]
Plot categorical and continuous metadata into dimensionality reduction.
- Parameters
scplus_obj (class::SCENICPLUS) – A SCENICPLUS object with dimensionality reductions.
reduction_name (str) – Name of the dimensionality reduction to use
variables (list) – List of variables to plot. They should be included in class::SCENICPLUS.metadata_cell.
remove_nan (bool, optional) – Whether to remove data points for which the variable value is ‘nan’. Default: True
show_label (bool, optional) – For categorical variables, whether to show the label in the plot. Default: True
show_legend (bool, optional) – For categorical variables, whether to show the legend next to the plot. Default: False
cmap (str or 'matplotlib.cm', optional) – For continuous variables, color map to use for the legend color bar. Default: cm.viridis
dot_size (int, optional) – Dot size in the plot. Default: 10
text_size (int, optional) – For categorical variables and if show_label is True, size of the labels in the plot. Default: 10
alpha (float, optional) – Transparency value for the dots in the plot. Default: 1
seed (int, optional) – Random seed used to select random colors. Default: 555
color_dictionary (dict, optional) – A dictionary containing an entry per variable, whose values are dictionaries with variable levels as keys and corresponding colors as values. Default: None
figsize (tuple, optional) – Size of the figure. If num_columns is 1, this is the size for each figure; if num_columns is above 1, this is the overall size of the figure (if keeping default, it will be the size of each subplot in the figure). Default: (6.4, 4.8)
num_columns (int, optional) – For multiplot figures, indicates the number of columns (the number of rows will be automatically determined based on the number of plots). Default: 1
selected_cells (list, optional) – A list with selected cells to plot.
save (str, optional) – Path to save plot. Default: None.
- scenicplus.dimensionality_reduction.plot_metadata_given_ax(scplus_obj, ax: <module 'matplotlib.axes' from '/home/docs/checkouts/readthedocs.org/user_builds/scenicplus/envs/latest/lib/python3.8/site-packages/matplotlib/axes/__init__.py'>, reduction_name: str, variable: str, remove_nan: typing.Optional[bool] = True, show_label: typing.Optional[bool] = True, show_legend: typing.Optional[bool] = False, cmap: typing.Optional[typing.Union[str, matplotlib.cm]] = <matplotlib.colors.ListedColormap object>, dot_size: typing.Optional[int] = 10, text_size: typing.Optional[int] = 10, alpha: typing.Optional[typing.Union[float, int]] = 1, seed: typing.Optional[int] = 555, color_dictionary: typing.Optional[typing.Dict[str, str]] = {}, selected_cells: typing.Optional[typing.List[str]] = None)[source]
Plot categorical and continuous metadata into dimensionality reduction.
- Parameters
scplus_obj (class::SCENICPLUS) – A SCENICPLUS object with dimensionality reductions.
ax (matplotlib.axes) – Axes to which to plot metadata.
reduction_name (str) – Name of the dimensionality reduction to use
variable (Str) – Variable to plot. It should be included in class::SCENICPLUS.metadata_cell.
remove_nan (bool, optional) – Whether to remove data points for which the variable value is ‘nan’. Default: True
show_label (bool, optional) – For categorical variables, whether to show the label in the plot. Default: True
show_legend (bool, optional) – For categorical variables, whether to show the legend next to the plot. Default: False
cmap (str or 'matplotlib.cm', optional) – For continuous variables, color map to use for the legend color bar. Default: cm.viridis
dot_size (int, optional) – Dot size in the plot. Default: 10
text_size (int, optional) – For categorical variables and if show_label is True, size of the labels in the plot. Default: 10
alpha (float, optional) – Transparency value for the dots in the plot. Default: 1
seed (int, optional) – Random seed used to select random colors. Default: 555
color_dictionary (dict, optional) – A dictionary containing an entry per variable, whose values are dictionaries with variable levels as keys and corresponding colors as values. Default: None
figsize (tuple, optional) – Size of the figure. If num_columns is 1, this is the size for each figure; if num_columns is above 1, this is the overall size of the figure (if keeping default, it will be the size of each subplot in the figure). Default: (6.4, 4.8)
num_columns (int, optional) – For multiplot figures, indicates the number of columns (the number of rows will be automatically determined based on the number of plots). Default: 1
selected_cells (list, optional) – A list with selected cells to plot.
save (str, optional) – Path to save plot. Default: None.
- scenicplus.dimensionality_reduction.run_eRegulons_pca(scplus_obj: scenicplus.scenicplus_class.SCENICPLUS, scale: Optional[bool] = True, auc_key: Optional[str] = 'eRegulon_AUC', signature_keys: Optional[List[str]] = ['Gene_based', 'Region_based'], reduction_name: Optional[str] = 'eRegulons_PCA', random_state: Optional[int] = 555, selected_regulons: Optional[List[int]] = None, selected_cells: Optional[List[str]] = None, n_pcs: Optional[int] = 50, **kwargs)[source]
Run UMAP and add it to the dimensionality reduction dictionary.
- Parameters
scplus_obj (class::SCENICPLUS) – A SCENICPLUS object with eRegulons AUC computed.
scale (bool, optional) – Whether to scale the cell-topic or topic-regions contributions prior to the dimensionality reduction. Default: False
auc_key (str, optional) – Key to extract AUC values from. Default: ‘eRegulon_AUC’
signature_keys (List, optional) – Keys to extract AUC values from. Default: [‘Gene_based’, ‘Region_based’]
reduction_name (str, optional) – Key used to store dimensionality reduction in scplud_obj.dr_cell. Default: eRegulon_AUC.
random_state (int, optional) – Seed parameter for running UMAP. Default: 555
selected_regulons (list, optional) – A list with selected regulons to be used for clustering. Default: None (use all regulons)
selected_cells (list, optional) – A list with selected features cells to cluster. Default: None (use all cells)
n_pcs (int, optional) – Number of principle components to calculate. Default: 50
**kwargs – Parameters to pass to umap.UMAP.
- scenicplus.dimensionality_reduction.run_eRegulons_tsne(scplus_obj: scenicplus.scenicplus_class.SCENICPLUS, scale: Optional[bool] = True, auc_key: Optional[str] = 'eRegulon_AUC', signature_keys: Optional[List[str]] = ['Gene_based', 'Region_based'], reduction_name: Optional[str] = 'eRegulons_tSNE', random_state: Optional[int] = 555, selected_regulons: Optional[List[int]] = None, selected_cells: Optional[List[str]] = None, **kwargs)[source]
Run TSNE and add it to the dimensionality reduction dictionary.
- Parameters
scplus_obj (class::SCENICPLUS) – A SCENICPLUS object with eRegulons AUC computed.
scale (bool, optional) – Whether to scale the enrichments prior to the dimensionality reduction. Default: False
auc_key (str, optional) – Key to extract AUC values from. Default: ‘eRegulon_AUC’
signature_keys (List, optional) – Keys to extract AUC values from. Default: [‘Gene_based’, ‘Region_based’]
reduction_name (str, optional) – Key used to store dimensionality reduction in scplud_obj.dr_cell. Default: eRegulon_AUC.
random_state (int, optional) – Seed parameter for running UMAP. Default: 555
selected_regulons (list, optional) – A list with selected regulons to be used for clustering. Default: None (use all regulons)
selected_cells (list, optional) – A list with selected features cells to cluster. Default: None (use all cells)
**kwargs – Parameters to pass to the tSNE functions.
- scenicplus.dimensionality_reduction.run_eRegulons_umap(scplus_obj: scenicplus.scenicplus_class.SCENICPLUS, scale: Optional[bool] = True, auc_key: Optional[str] = 'eRegulon_AUC', signature_keys: Optional[List[str]] = ['Gene_based', 'Region_based'], reduction_name: Optional[str] = 'eRegulons_UMAP', random_state: Optional[int] = 555, selected_regulons: Optional[List[int]] = None, selected_cells: Optional[List[str]] = None, **kwargs)[source]
Run UMAP and add it to the dimensionality reduction dictionary.
- Parameters
scplus_obj (class::SCENICPLUS) – A SCENICPLUS object with eRegulons AUC computed.
scale (bool, optional) – Whether to scale the cell-topic or topic-regions contributions prior to the dimensionality reduction. Default: False
auc_key (str, optional) – Key to extract AUC values from. Default: ‘eRegulon_AUC’
signature_keys (List, optional) – Keys to extract AUC values from. Default: [‘Gene_based’, ‘Region_based’]
reduction_name (str, optional) – Key used to store dimensionality reduction in scplud_obj.dr_cell. Default: eRegulon_AUC.
random_state (int, optional) – Seed parameter for running UMAP. Default: 555
selected_regulons (list, optional) – A list with selected regulons to be used for clustering. Default: None (use all regulons)
selected_cells (list, optional) – A list with selected features cells to cluster. Default: None (use all cells)
**kwargs – Parameters to pass to umap.UMAP.
eRegulon specificity score (eRSS)
Calculate the specificty of eRegulons in clusters of cells.
Calculates the distance between the real distribution of eRegulon AUC values and a fictional distribution where the eRegulon is only expressed/accessible in cells of a certain cluster.
- scenicplus.RSS.plot_rss(scplus_obj: scenicplus.scenicplus_class.SCENICPLUS, rss_key: str, top_n: Optional[int] = 5, selected_groups: Optional[List[str]] = None, num_columns: Optional[int] = 1, figsize: Optional[Tuple[float, float]] = (6.4, 4.8), fontsize: Optional[int] = 12, save: Optional[str] = None)[source]
Plot RSS values per group
- Parameters
scplus_obj (class::SCENICPLUS) – A SCENICPLUS object with eRegulons AUC computed.
rss_key (str, optional) – Key to extract RSS values from.
top_n (int, optional) – Number of top eRegulons to highlight.
selected_groups (List, optional) – Groups to plot. Default: None (all)
num_columns (int, optional) – Number of columns for multiplotting
figsize (tuple, optional) – Size of the figure. If num_columns is 1, this is the size for each figure; if num_columns is above 1, this is the overall size of the figure (if keeping default, it will be the size of each subplot in the figure). Default: (6.4, 4.8)
fontsize (int, optional) – Size of the eRegulons names in plot.
save (str, optional) – Path to save plot. Default: None.
- scenicplus.RSS.regulon_specificity_scores(scplus_obj: scenicplus.scenicplus_class.SCENICPLUS, variable: str, auc_key: Optional[str] = 'eRegulon_AUC', signature_keys: Optional[List[str]] = ['Gene_based', 'Region_based'], selected_regulons: Optional[List[int]] = None, scale: Optional[bool] = False, out_key_suffix: Optional[str] = '')[source]
Calculate the Regulon Specificty Scores (RSS). [doi: 10.1016/j.celrep.2018.10.045]
- Parameters
scplus_obj (class::SCENICPLUS) – A SCENICPLUS object with eRegulons AUC computed.
variable (str) – Variable to calculate the RSS values for.
auc_key (str, optional) – Key to extract AUC values from. Default: ‘eRegulon_AUC’
signature_keys (List, optional) – Keys to extract AUC values from. Default: [‘Gene_based’, ‘Region_based’]
scale (bool, optional) – Whether to scale the enrichment prior to the clustering. Default: False
out_key_suffix (str, optional) – Suffix to add to the variable name to store the values (at scplus_obj.uns[‘RSS’])
Network
export eRegulons to eGRN network and plot.
- scenicplus.networks.concentrical_layout(G, dist_genes=1, dist_TF=0.1)[source]
Generate custom concentrical layout
- Parameters
G (Graph) – A networkx graph
dist_genes (int, optional) – Distance from the regions to the genes
dist_TF – Distance from the TF to the regions
- scenicplus.networks.create_nx_graph(nx_tables: Dict, use_edge_tables: List = ['TF2R', 'R2G'], color_edge_by: Dict = {}, transparency_edge_by: Dict = {}, width_edge_by: Dict = {}, color_node_by: Dict = {}, transparency_node_by: Dict = {}, size_node_by: Dict = {}, shape_node_by: Dict = {}, label_size_by: Dict = {}, label_color_by: Dict = {}, layout: str = 'concentrical_layout', lc_dist_genes: float = 0.8, lc_dist_TF: float = 0.1, scale_position_by: float = 250)[source]
Format node/edge feature tables into a graph
- Parameters
nx_tables (Dict) – Dictionary with node/edge feature tables as produced by create_nx_tables
use_edge_tables (List, optional) – List of edge tables to use
color_edge_by (Dict, optional) – A dictionary containing for a given edge key the variable and color map to color edges by. If the variable is categorical, the entry ‘categorical_color’ can be provided as a dictionary with category: color. If it is a continuous variable a color map can be provided as continuous_color and entried v_max and v_min can be provided to control the min and max values of the scale. Alternatively, one fixed color can use by using ‘fixed_color’ as variable, alterntively adding an entry fixed_color: color to the dictionary.
transparency_edge_by (Dict, optional) – A dictionary containing for a given edge key the variable and the max and min alpha values. The variable name has to be provided (only continuous variables accepted), together with v_max/v_mix parameters if desired. Alternatively, one fixed alpha can use by using ‘fixed_alpha’ as variable, alterntively adding an entry fixed_alpha: size to the dictionary.
width_edge_by (Dict, optional) – A dictionary containing for a given edge key the variable and the max and min sizes. The variable name has to be provided (only continuous variables accepted), together with max_size/min_size parameters if desired. Alternatively, one fixed size can use by using ‘fixed_size’ as variable, alterntively adding an entry fixed_size: size to the dictionary.
color_node_by (Dict, optional) – A dictionary containing for a given node key the variable and color map to color edges by. If the variable is categorical, the entry ‘categorical_color’ can be provided as a dictionary with category: color. If it is a continuous variable a color map can be provided as continuous_color and entried v_max and v_min can be provided to control the min and max values of the scale. Alternatively, one fixed color can use by using ‘fixed_color’ as variable, alterntively adding an entry fixed_color: color to the dictionary.
transparency_node_by (Dict, optional) – A dictionary containing for a given node key the variable and the max and min alpha values. The variable name has to be provided (only continuous variables accepted), together with v_max/v_mix parameters if desired. Alternatively, one fixed alpha can use by using ‘fixed_alpha’ as variable, alterntively adding an entry fixed_alpha: size to the dictionary.
size_node_by (Dict, optional) – A dictionary containing for a given node key the variable and the max and min sizes. The variable name has to be provided (only continuous variables accepted), together with max_size/min_size parameters if desired. Alternatively, one fixed size can use by using ‘fixed_size’ as variable, alterntively adding an entry fixed_size: size to the dictionary.
shape_node_by (Dict, optional) – A dictionary containing for a given node key the variable and shapes. The variable name has to be provided (only categorical variables accepted). Alternatively, one fixed shape can use by using ‘fixed_shape’ as variable, alterntively adding an entry fixed_shape: size to the dictionary.
label_size_by (Dict, optional) – A dictionary containing for a given node key the variable and the max and min sizes. The variable name has to be provided (only continuous variables accepted), together with max_size/min_size parameters if desired. Alternatively, one fixed size can use by using ‘fixed_label_size’ as variable, alterntively adding an entry fixed_label_size: size to the dictionary.
label_color_by (Dict, optional) – A dictionary containing for a given node key the variable and a color dictionary. The variable name has to be provided (only categorical variables accepted), together with a color dictionary if desired. Alternatively, one fixed color can use by using ‘fixed_label_color’ as variable, alterntively adding an entry fixed_label_color: size to the dictionary.
layout (str, optional) – Layout to use. Options are: ‘concentrical_layout’ (SCENIC+ custom layout) or kamada_kawai_layout (from networkx).
lc_dist_genes (float, optional) – Distance between regions and genes. Only used if using concentrical_layout.
lc_dist_TF (float, optional) – Distance between TF and regions. Only used if using concentrical_layout.
scale_position_by (int, optional) – Value to scale positions for visualization in pyvis.
- scenicplus.networks.create_nx_tables(scplus_obj: SCENICPLUS, eRegulon_metadata_key: str = 'eRegulon_metadata', subset_eRegulons: List = None, subset_regions: List = None, subset_genes: List = None, add_differential_gene_expression: bool = False, add_differential_region_accessibility: bool = False, differential_variable: List = [])[source]
A function to format eRegulon data into tables for plotting eGRNs.
- Parameters
scplus_obj (SCENICPLUS) – A SCENICPLUS object with eRegulons
eRegulon_metadata_key (str, optional) – Key where the eRegulon metadata dataframe is stored
subset_eRegulons (list, optional) – List of eRegulons to subset
subset_regions (list, optional) – List of regions to subset
subset_genes (list, optional) – List of genes to subset
add_differential_gene_expression (bool, optional) – Whether to calculate differential gene expression logFC for a given variable
add_differential_region_accessibility (bool, optional) – Whether to calculate differential region accessibility logFC for a given variable
differential_variable (list, optional) – Variable to calculate differential gene expression or region accessibility.
- scenicplus.networks.export_to_cytoscape(G, pos, out_file: str, pos_scaling_factor: int = 200, size_scaling_factor: int = 1)[source]
A function to export to cytoscape :param G: A networkx graph. :type G: Graph :param Pos: generated by running create_nx_graph. :type Pos: coordinates of graph nodes :param out_file: Path to wich to save the export. :type out_file: str :param pos_scaling_factor: Factor by which to scale the graph node coordinates. :type pos_scaling_factor: int, optional :param size_scaling_factor: Factor by which tos cale the graph node sizes. :type size_scaling_factor: int, optional
Correlation plot
Plot correlation and overlap of eRegulons
- scenicplus.plotting.correlation_plot.correlation_heatmap(scplus_obj: scenicplus.scenicplus_class.SCENICPLUS, auc_key: Optional[str] = 'eRegulon_AUC', signature_keys: Optional[List[str]] = ['Gene_based', 'Region_based'], scale: Optional[bool] = False, linkage_method: Optional[str] = 'average', fcluster_threshold: Optional[float] = 0.1, selected_regulons: Optional[List[int]] = None, cmap: Optional[str] = 'viridis', plotly_height: Optional[int] = 1000, fontsize: Optional[int] = 3, save: Optional[str] = None, use_plotly: Optional[int] = True, figsize: Optional[Tuple[int, int]] = (20, 20))[source]
Plot correlation between eRegulons enrichment,
- Parameters
scplus_obj (class::SCENICPLUS) – A SCENICPLUS object with eRegulons AUC computed.
auc_key (str, optional) – Key to extract AUC values from. Default: ‘eRegulon_AUC’
signature_keys (List, optional) – Keys to extract AUC values from. Default: [‘Gene_based’, ‘Region_based’]
scale (bool, optional) – Whether to scale the enrichments prior to the dimensionality reduction. Default: False
linkage_method (str, optional) – Linkage method to use for clustering. See scipy.cluster.hierarchy.linkage.
fcluster_threshold (float, optional) – Threshold to use to divide hierarchical clustering into clusters. See scipy.cluster.hierarchy.fcluster.
selected_regulons (list, optional) – A list with selected regulons to be used for clustering. Default: None (use all regulons)
cmap (str or 'matplotlib.cm', optional) – For continuous variables, color map to use for the legend color bar. Default: cm.viridis
plotly_height (int, optional) – Height of the plotly plot. Width will be adjusted accordingly
fontsize (int, optional) – Labels fontsize
save (str, optional) – Path to save heatmap as file
use_plotly (bool, optional) – Use plotly or seaborn to generate the image
figsize (tupe, optional) – Matplotlib figsize, used only if use_plotly == False
- scenicplus.plotting.correlation_plot.fisher_exact_test_heatmap(scplus_obj, gene_or_region_based: str = 'Gene_based', signature_key: Optional[str] = 'eRegulon_signatures', selected_regulons: Optional[List[int]] = None, linkage_method: Optional[str] = 'average', fcluster_threshold: Optional[float] = 0.1, cmap: Optional[str] = 'viridis', plotly_height: Optional[int] = 1000, fontsize: Optional[int] = 3, save: Optional[str] = None, use_plotly: Optional[int] = True, figsize: Optional[Tuple[int, int]] = (20, 20), vmin=None, vmax=None, return_data=False)[source]
Plot jaccard index of regions/genes
- Parameters
scplus_obj (class::SCENICPLUS) – A SCENICPLUS object with eRegulon signatures.
method (str) – Wether to use Jaccard (jaccard) or normalized intersection (intersect) as metric
gene_or_region_based (str) – Gene_based or Region_based eRegulon signatures to use.
signature_key (List, optional) – Key to extract eRegulon signatures from
selected_regulons (list, optional) – A list with selected regulons to be used for clustering. Default: None (use all regulons)
linkage_method (str, optional) – Linkage method to use for clustering. See scipy.cluster.hierarchy.linkage.
fcluster_threshold (float, optional) – Threshold to use to divide hierarchical clustering into clusters. See scipy.cluster.hierarchy.fcluster.
cmap (str or 'matplotlib.cm', optional) – For continuous variables, color map to use for the legend color bar. Default: cm.viridis
plotly_height (int, optional) – Height of the plotly plot. Width will be adjusted accordingly
fontsize (int, optional) – Labels fontsize
save (str, optional) – Path to save heatmap as file
use_plotly (bool, optional) – Use plotly or seaborn to generate the image
figsize (tupe, optional) – Matplotlib figsize, used only if use_plotly == False
return_data (boolean, optional) – Return data
plot_dendrogram (boolean, optional) –
- scenicplus.plotting.correlation_plot.jaccard_heatmap(scplus_obj: scenicplus.scenicplus_class.SCENICPLUS, method: str = 'jaccard', gene_or_region_based: str = 'Gene_based', signature_key: Optional[str] = 'eRegulon_signatures', selected_regulons: Optional[List[int]] = None, linkage_method: Optional[str] = 'average', fcluster_threshold: Optional[float] = 0.1, cmap: Optional[str] = 'viridis', plotly_height: Optional[int] = 1000, fontsize: Optional[int] = 3, save: Optional[str] = None, use_plotly: Optional[int] = True, figsize: Optional[Tuple[int, int]] = (20, 20), vmin=None, vmax=None, return_data=False)[source]
Plot jaccard index of regions/genes
- Parameters
scplus_obj (class::SCENICPLUS) – A SCENICPLUS object with eRegulon signatures.
method (str) – Wether to use Jaccard (jaccard) or normalized intersection (intersect) as metric
gene_or_region_based (str) – Gene_based or Region_based eRegulon signatures to use.
signature_key (List, optional) – Key to extract eRegulon signatures from
selected_regulons (list, optional) – A list with selected regulons to be used for clustering. Default: None (use all regulons)
linkage_method (str, optional) – Linkage method to use for clustering. See scipy.cluster.hierarchy.linkage.
fcluster_threshold (float, optional) – Threshold to use to divide hierarchical clustering into clusters. See scipy.cluster.hierarchy.fcluster.
cmap (str or 'matplotlib.cm', optional) – For continuous variables, color map to use for the legend color bar. Default: cm.viridis
plotly_height (int, optional) – Height of the plotly plot. Width will be adjusted accordingly
fontsize (int, optional) – Labels fontsize
save (str, optional) – Path to save heatmap as file
use_plotly (bool, optional) – Use plotly or seaborn to generate the image
figsize (tupe, optional) – Matplotlib figsize, used only if use_plotly == False
return_data (boolean, optional) – Return data
plot_dendrogram (boolean, optional) –
Coverage plot
Plot chromatin accessibility profiles and region to gene arcs.
- scenicplus.plotting.coverageplot.coverage_plot(SCENICPLUS_obj: scenicplus.scenicplus_class.SCENICPLUS, bw_dict: Mapping[str, str], region: str, genes_violin_plot: Optional[Union[str, List]] = None, genes_arcs: Optional[Union[str, List]] = None, gene_height: int = 1, exon_height: int = 4, meta_data_key: Optional[str] = None, pr_consensus_bed: Optional[pyranges.pyranges.PyRanges] = None, region_bed_height: int = 1, pr_gtf: Optional[pyranges.pyranges.PyRanges] = None, pr_interact: Optional[pyranges.pyranges.PyRanges] = None, bw_ymax: Optional[float] = None, color_dict: Optional[Mapping[str, str]] = None, cmap='tab20', plot_order: Optional[list] = None, figsize: tuple = (6, 8), fontsize_dict={'bigwig_label': 9, 'bigwig_tick_label': 5, 'gene_label': 9, 'title': 12, 'violinplots_xlabel': 9, 'violinplots_ylabel': 9}, gene_label_offset=3, arc_rad=0.5, arc_lw=1, cmap_violinplots='Greys', violinplots_means_color='black', violinplots_edge_color='black', violoinplots_alpha=1, width_ratios_dict={'bigwig': 3, 'violinplots': 1}, height_ratios_dict={'arcs': 5, 'bigwig_violin': 1, 'custom_ax': 2, 'genes': 0.5}, sort_vln_plots: bool = False, add_custom_ax: Optional[int] = None) matplotlib.figure.Figure [source]
Inspired by: https://satijalab.org/signac/reference/coverageplot
Generates a figure showing chromatin accessibility coverage tracks, gene expression violin plots and region to gene interactions.
- Parameters
- SCENICPLUS_obj
An instance of class ~scenicplus.scenicplus_class.SCENICPLUS.
- bw_dict
A dict containing celltype annotations/cell groups as keys and paths to bigwig files as values.
- region
A string specifying the region of interest, in chr:start-end format.
- genes_violin_plot
A list or string specifying for which gene(s) to plot gene expression violin plots. default: None
- genes_arcs
A list or string specifying for which gene(s) to plot arcs default: None (i.e. all genes in window)
- gene_height
An int specifying the size of non-exon parts of a gene (shown underneath the coverage plot). default: 1
- exon_height
An int specifying the size of nexon parts of a gene (shown underneath the coverage plot). default: 2
- meta_data_key
A key specifying were to find annotations corresponding to the keys in bw_dict in SCENICPLUS_obj.metadata_cell default: None
- pr_consensus_bed
An instance of class pyranges.PyRanges containing consensus peaks. Names of these peaks should correspond to annotations. default: None
- region_bed_height
An int specifying with which height to draw lines corresponding to regions in pr_consensus_bed default: 1
- pr_gtf
An instance of class pyranges.PyRanges containing gtf-formatted information about gene structure. default: None
- pr_interact
An instance of class pyranges.PyRanges containing region to gene link information in ucsc interact format (use scenicplus.utils.get_interaction_pr to create such an object). default: None
- bw_ymax
A float specifying the maximum height at which to draw coverage plots. default: None
- color_dict
A dict specifying colors for each key in bw_dict. default: None
- cmap
A string specifying a matplotlib.cm colormap to use for coloring coverage plots. default: ‘tab20’
- plot_order
A list specifying the order to use for plotting coverage plots and violin plots. default: None
- figsize
A tuple specifying the fig size/ default: (6, 8)
- fontsize_dict
A dictionary specifying the fontsize of various labels in the plot. default: {‘bigwig_label’: 9, ‘gene_label’: 9, ‘violinplots_xlabel’: 9, ‘title’: 12, ‘bigwig_tick_label’: 5}
- gene_label_offset
The y-offset of the label underneath each gene. default: 3
- arc_rad
The amount of radians the region-to-gene arc should be bend. default: 0.5
- arc_lw
The linewidth of the region-to-gene arcs. default: 1
- cmap_violinplots
A string specifying a matplotlib.cm colormap to use for coloring violinplots. default: ‘Greys’
- violinplots_means_color
A string specifying which color to use to indicate the mean value in violinplots. default: ‘black’
- violinplots_edge_color
A string specifying which color to use for the edge of the violinplots. default: ‘black’
- violoinplots_alpha
The alpha value of the violinplots facecolor. default: 1
- width_ratios_dict
A dict specifying the ratio in vertical direction each part of the plot should use. default: {‘bigwig’: 3, ‘violinplots’: 1}
- height_ratios_dict
A dict specifying the ratio in horizontal direction each part of the plot should use. default: {‘bigwig_violin’: 1, ‘genes’: 0.5, ‘arcs’: 5}
dotplot
Plot TF expression, motif enrichment and AUC values of target genes and regions in a dotplot.
- scenicplus.plotting.dotplot.dotplot(df_dotplot: pandas.core.frame.DataFrame, ax: Optional[matplotlib.pyplot.axes] = None, region_set_key: str = 'Name', size_var: str = 'TF_expression', color_var: str = 'Cistrome_AUC', order_group: Optional[list] = None, order_cistromes: Optional[list] = None, order_cistromes_by_max: str = 'TF_expression', cluster: Optional[str] = None, n_clust: int = 2, min_point_size: float = 3, max_point_size: float = 30, cmap: str = 'viridis', vmin: float = 0, vmax: Optional[float] = None, x_tick_rotation: float = 45, x_tick_ha: str = 'right', fontsize: float = 9, z_score_expr: bool = True, z_score_enr: bool = True, grid_color='grey', grid_lw=0.5, highlight=None, highlight_lw=1, highlight_lc='black', figsize: Optional[Tuple[float, float]] = (10, 10), use_plotly=True, plotly_height=1000, save=None)[source]
DEPRECATED Function to generate dotplot
- Parameters
df_dotplot (pd.DataFrame) – A pd.DataFrame with a column Group and varaibles to use for the dotplot
ax (plt.axes) – An ax object, only require if use_plotly == False.
enrichment_variable (str, optional) – Variable to use for motif/TF enrichment. Default: ‘Cistrome_AUC;
region_set_key (str, optional) – Name of the column where TF/cistromes are. Default: ‘Cistrome’
size_var (str, optional) – Variable in df_dotplot to code the dot size with. Default: ‘Cistrome_AUC’
color_var (str, optional) – Variable in df_dotplot to code the dot color with. Default: ‘Cistrome_AUC’
order_group (list, optional) – Order to plot the groups by. Default: None (given)
order_cistromes (list, optional) – Order to plot the cistromes by. Default: None (given)
order_cistromes_by_max (str, optional) – Variable to order the cistromes with by values in group, to form a diagonal. Default: None
cluster (str, optional) – Whether to cluster cistromes (or TFs)/groups. It will be overwritten if order_cistromes/order_group/order_cistromes_by_max are specified.
n_clust (int, optional) – Number of clusters to form if cluster is specified. Default: 2
min_point_size (int, optional) – Minimal point size. Only available with Cistrome AUC values.
max_point_size (int, optional) – Maximum point size. Only available with Cistrome AUC values.
cmap (str, optional) – Color map to use.
vmin (int, optional) – Minimal color value.
vmax (int, optional) – Maximum color value
x_tick_rotation (int, optional) – Rotation of the x-axis label. Only if use_plotly = False
fontsize (int, optional) – Labels fontsize
z_score_expr (bool, optional) – Whether to z-normalize expression values
z_score_enr (bool, optional) – Whether to z-normalize enrichment values
grid_color (str, optional) – Color for grid. Only if use_plotly = False
grid_lw (float, optional) – Line width of grid. Only if use_plotly = False
highlight (list, optional) – Whether to highlight specific TFs/cistromes. Only if use_plotly = False
highlight_lw (float, optional) – Line width of highlight. Only if use_plotly = False
highlight_lc (str, optional) – Color of highlight. Only if use_plotly = False
figsize (tuple, optional) – Figure size. Only if use_plotly = False
use_plotly (bool, optional) – Whether to use plotly for plotting. Default: True
plotly_height (int, optional) – Height of the plotly plot. Width will be adjusted accordingly
save (str, optional) – Path to save dotplot as file
- scenicplus.plotting.dotplot.generate_dotplot_df(scplus_obj: scenicplus.scenicplus_class.SCENICPLUS, size_matrix: pandas.core.frame.DataFrame, color_matrix: pandas.core.frame.DataFrame, scale_size_matrix: bool = True, scale_color_matrix: bool = True, group_variable: Optional[str] = None, subset_eRegulons: Optional[list] = None) pandas.core.frame.DataFrame [source]
Function to generate dotplot dataframe from cistrome AUC enrichment
- Parameters
- scplus_obj: `class::SCENICPLUS`
A
SCENICPLUS
object.- size_matrix: pd.DataFrame
A pd.DataFrame containing values to plot using size scale.
- color_matrix
A pd.DataFrame containing values to plot using color scale.
- scale_size_matrix: bool
Scale size matrix between 0 and 1 along index.
- scale_color_matrix: bool
Scale color matrix between 0 and 1 along index.
- group_variable: str:
Variable by which to group cell barcodes by (needed if the index of size or color matrix are cells.)
- subset_eRegulons: List
List of eRegulons to plot.
- Returns
- ——-
- pd.DataFrame
- scenicplus.plotting.dotplot.generate_dotplot_df_AUC(scplus_obj: scenicplus.scenicplus_class.SCENICPLUS, auc_key: str, enrichment_key: str, group_variable: str, subset_cells: Optional[list] = None, subset_eRegulons: Optional[list] = None, use_pseudobulk: bool = False, normalize_expression: bool = True, standardize_expression: bool = False, standardize_auc: bool = False)[source]
DEPRECATED Function to generate dotplot dataframe from cistrome AUC enrichment
- Parameters
scplus_obj (class::SCENICPLUS) – A
SCENICPLUS
object with motif enrichment results from pycistarget (scplus_obj.menr).enrichment_key (str) – Key of the motif enrichment result to use.
group_variable (str) – Group variable to use to calculate TF expression per group. Levels of this variable should match with the entries in the selected motif enrichment dictionary.
subset_cells (list, optional) – Subset of classes to use. Default: None (use all)
subset_eRegulons (list, optional) – List of cistromes to use. Default: None (use all)
use_pseudobulk (bool, optional) – Whether to use pseudobulk to calculate gene expression. Only available if there is pseudobulk profiles for group_variable. Default: False
normalize_expression (bool, optional) – Whether to log(CPM) normalize gene expression. Default: True
standardize_expression (bool, optional) – Wheter to standarize gene expression between o and 1. Default: False
standardize_auc (bool, optional) – Wheter to standarize AUC values between o and 1. Default: False
- Returns
- A data frame with enrichment values per TF and cell group to use as input for dotplot().
- scenicplus.plotting.dotplot.generate_dotplot_df_motif_enrichment(scplus_obj: scenicplus.scenicplus_class.SCENICPLUS, enrichment_key: str, group_variable: Optional[str] = None, barcode_groups: Optional[dict] = None, subset: Optional[list] = None, subset_TFs: Optional[list] = None, use_pseudobulk: bool = False, use_only_direct: bool = False, normalize_expression: bool = True, standardize_expression: bool = False)[source]
DEPRECATED Function to generate dotplot dataframe from motif enrichment results
- Parameters
scplus_obj (class::SCENICPLUS) – A
SCENICPLUS
object with motif enrichment results from pycistarget (scplus_obj.menr).enrichment_key (str) – Key of the motif enrichment result to use.
group_variable (str, optional) – Group variable to use to calculate TF expression per group. Levels of this variable should match with the entries in the selected motif enrichment dictionary. Only required if barcode groups is not provided.
barcode_groups (Dict, optional) – A dictionary containing cell barcodes per class to calculate TF expression per group. Keys of the dictionary should match the keys in the selected motif enrichment dictionary. Only required if group_variable is not provided.
subset (list, optional) – Subset of classes to use. Default: None (use all)
subset_TFs (list, optional) – List of TFs to use. Default: None (use all)
use_pseudobulk (bool, optional) – Whether to use pseudobulk to calculate gene expression. Only available if there is pseudobulk profiles for group_variable. Default: False
use_only_direct (bool, optional) – Whether to only use NES values of directly annotated motifs. Default: False
normalize_expression (bool, optional) – Whether to log(CPM) normalize gene expression. Default: True
standardize_expression (bool, optional) – Wheter to standarize gene expression between o and 1. Default: False
- Returns
- A data frame with enrichment values per TF and cell group to use as input for dotplot().
- scenicplus.plotting.dotplot.heatmap_dotplot(scplus_obj: scenicplus.scenicplus_class.SCENICPLUS, size_matrix: pandas.core.frame.DataFrame, color_matrix: pandas.core.frame.DataFrame, scale_size_matrix: bool = True, scale_color_matrix: bool = True, group_variable: Optional[str] = None, subset_eRegulons: Optional[list] = None, sort_by: str = 'color_val', index_order: Optional[list] = None, save: Optional[str] = None, figsize: tuple = (5, 8), split_repressor_activator: bool = True, orientation: str = 'vertical')[source]
Function to generate dotplot dataframe from cistrome AUC enrichment
- Parameters
- scplus_obj: `class::SCENICPLUS`
A
SCENICPLUS
object.- size_matrix: pd.DataFrame
A pd.DataFrame containing values to plot using size scale.
- color_matrix
A pd.DataFrame containing values to plot using color scale.
- scale_size_matrix: bool
Scale size matrix between 0 and 1 along index.
- scale_color_matrix: bool
Scale color matrix between 0 and 1 along index.
- group_variable: str:
Variable by which to group cell barcodes by (needed if the index of size or color matrix are cells.)
- subset_eRegulons: List
List of eRegulons to plot.
- sort_by: str
Sort by color_val or size_val.
- index_order: list
Order of index to plot.
- figsize: tuple
size of the figure (x, y).
- split_repressor_activator: bool
Wether to split the plot on repressors/activators.
- orientation: str
Plot in horizontal or vertical orientation
Export
Export to loom
export SCENIC+ object to target genes and target regions loom file.
These files can be visualized in the SCope single cell viewer.
- scenicplus.loom.export_to_loom(scplus_obj: scenicplus.scenicplus_class.SCENICPLUS, signature_key: str, out_fname: str, eRegulon_metadata_key: Optional[str] = 'eRegulon_metadata', auc_key: Optional[str] = 'eRegulon_AUC', auc_thr_key: Optional[str] = 'eRegulon_AUC_thresholds', keep_direct_and_extended_if_not_direct: Optional[bool] = False, selected_features: Optional[List[str]] = None, selected_cells: Optional[List[str]] = None, cluster_annotation: Optional[List[str]] = None, tree_structure: Sequence[str] = (), title: Optional[str] = None, nomenclature: str = 'Unknown')[source]
Create SCope [Davie et al, 2018] compatible loom files
- Parameters
scplus_obj (class::SCENICPLUS) – A SCENIC+ object with eRegulons, AUCs, and AUC thresholds computed
signature_key (str) – Whether a ‘Gene_based’ or a ‘Region_based’ file should be produced. Possible values: ‘Gene_based’ or ‘Region_based’
out_fname (str) – Path to output file.
eRegulon_metadata_key (str, optional) – Slot where the eRegulon metadata is stored.
auc_key (str, optional) – Slot where the eRegulon AUC are stored
auc_thr_key (str, optional) – Slot where AUC thresholds are stored
keep_direct_and_extended_if_not_direct (bool, optional) – Keep only direct eregulons and add extended ones only if there is not a direct one.
selected_features (List, optional) – A list with selected genes/region to use.
selected_cells (List, optional) – A list with selected cells to use.
cluster_annotations (List, optional) – A list with variables to use as cluster annotations. By default, those included in the DEGs/DARs dictionary will be used (plus those specificed here)
tree_structure (sequence, optional) – A sequence of strings that defines the category tree structure. Needs to be a sequence of strings with three elements. Default: ()
title (str, optional) – The title for this loom file. If None than the basename of the filename is used as the title. Default: None
nomenclature (str, optional) – The name of the genome. Default: ‘Unknown’
References
Davie, K., Janssens, J., Koldere, D., De Waegeneer, M., Pech, U., Kreft, Ł., … & Aerts, S. (2018). A single-cell transcriptome atlas of the aging Drosophila brain. Cell, 174(4), 982-998. Van de Sande, B., Flerin, C., Davie, K., De Waegeneer, M., Hulselmans, G., Aibar, S., … & Aerts, S. (2020). A scalable SCENIC workflow for single-cell gene regulatory network analysis. Nature Protocols, 15(7), 2247-2276.